How do you graph #x+4y=4# using intercepts?
1 Answer
Sep 2, 2016
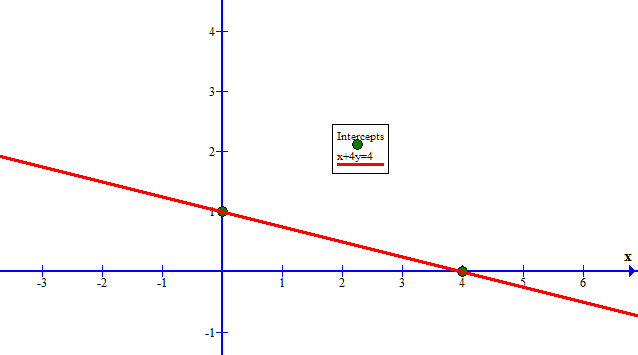
Plot the intercept points:
then draw a line through those points.
Explanation:
The y-intercept is the value of
For
giving the intercept point
Similarly, the x-intercept is the value of
For
giving the intercept point
Plotting these two points and drawing a line through them gives: