How do you graph # y=1/3x+2# by plotting points?
1 Answer


See explanation
Explanation:
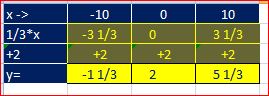
Build a table of values: Use different numbers for x than I have (gives you practice). Work out the
Choose multiples of
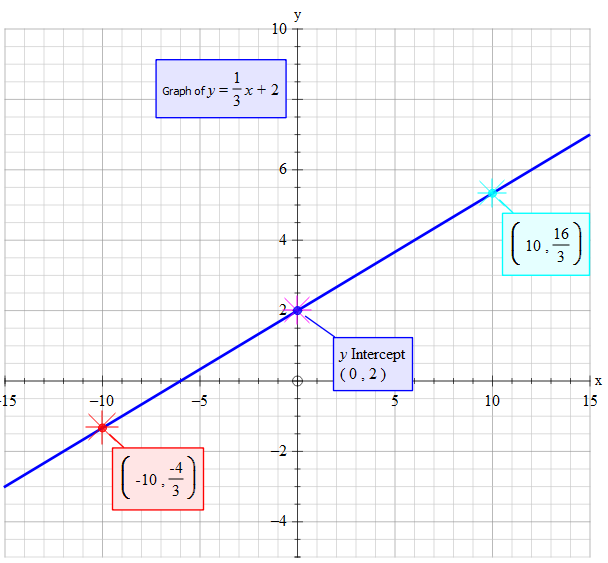
I have chosen three points as a check. All of them should line up. If not then there is an error so you will need to check your calculations and plotting.
My table gives the points:
Draw your axes for
Chose an appropriate scale and mark the values on the
Use these scales to mark your points and label them.
Draw a straight line through all three points. Extend the line to the edge of the squared area of the graph paper.
Put a title/heading on the graph stating what the equation is.