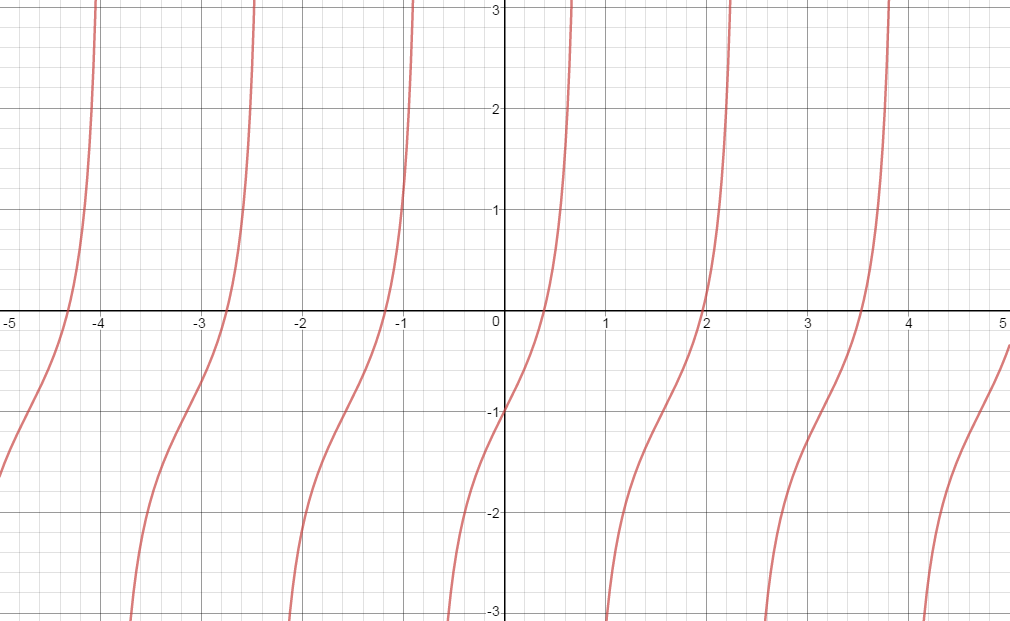
How do you graph # y=-1+tan2x#?

1 Answer

To graph #y=-1+tan 2x#, we determine the x and y intercepts and then add points that will enable to draw graph for 1 period. See the explanation.

Explanation:

The given equation

#y=-1+tan 2x#

Set #x=0# then solve for #y#

#y=-1+tan 2x#

#y=-1+tan 2(0)#

#y=-1#
We have the y-intercept at #(0, -1)#
~~~~~~~~~~~~~~~~~~~~~~~~~

Set now #y=0# then solve for #x#

#y=-1+tan 2x#
#0=-1+tan 2x#

#1=tan 2x#

#arctan (1)=arctan(tan 2x)#

#pi/4=2x#

#x=pi/8#
We have the x-intercept at #(pi/8, 0)#

Other points are #(pi/4, +oo)# and #(-pi/4, -oo)#

Since the graph of #y=-1+tan 2x# is periodic, there will be a repetition of the same graph every #pi/2# period. Kindly see the graph of #y=-1+tan 2x#

Desmos.com