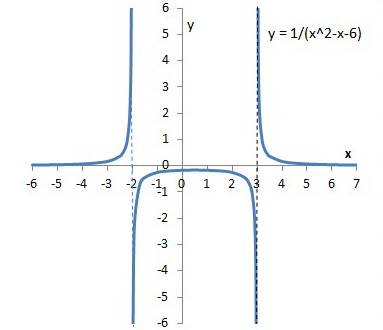
How do you graph #y=1/(x^2-x-6)#?

1 Answer
Aug 4, 2015

You find the intercepts and the asymptotes, and then you sketch the graph.

Explanation:

Step 1. Find the #y#-intercepts.

Set #x=0# and solve for #y#.

#f(0) =-1/6#

The #y#-intercept is at (#0,-1/6#).

Step 2. Find the #x#-intercepts.

Set #y=0# and solve for #x#.

#0 = 1/(x^2-x-6)#

#0 = -1#

This is an impossibility, so there is no #x#-intercept.

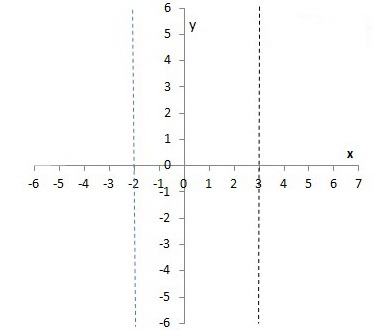
Step 3. Find the vertical asymptotes.

Set the denominator equal to zero and solve for #x#.

# x^2-x-6= 0#

#(x-3)(x+2) = 0#

#x =3# and #x=-2#

There are vertical asymptotes at #x = -2# and #x =3#.

Step 4. Find the horizontal asymptote.

The degree of the denominator is less than the degree of the numerator, so

The horizontal asymptote is at #y=0# (the #x#-axis).

Step 5. Draw your axes and the asymptotes.

Graph 1

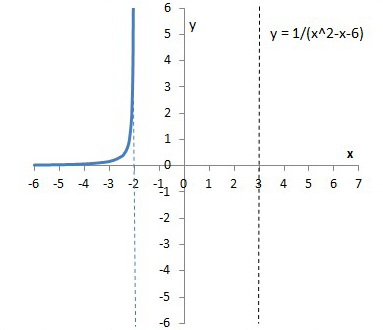
Step 6. Sketch the graph in each region defined by the asymptotes.

(a) The left hand region has the #x#-axis and #x=-2# as asymptotes.

#f(-3) = 1/6#.

The point at (#-3,1/6#) is in the second quadrant, so we have a "hyperbola" above the horizontal asymptote.

Graph 2

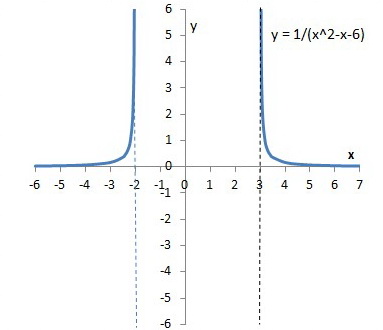
(b) The right hand region has #x =3# and the #x#-axis as asymptotes.

#f(4) = 1/6#.

The point at (#4,1/6#) is in the first quadrant, so we have a "hyperbola" above the horizontal asymptote.

So we have a mirror-image hyperbola in the first quadrant.

Graph 3

(c) In the middle region, we have

#f(0) =-1/6# and

#f(1) = -1/6#

#f(0.5) = -1/6.25#

The points at (#0,-1/6#), (#0.5,-1/6.25#), and (#1,-1/6#) are all below the #x#-axis, so we have an "inverted parabola" between the vertical asymptotes.

Graph 4