How do you graph y=-2+sin(2x+pi)?
1 Answer
Dec 2, 2016
Please see the explanation.
Explanation:
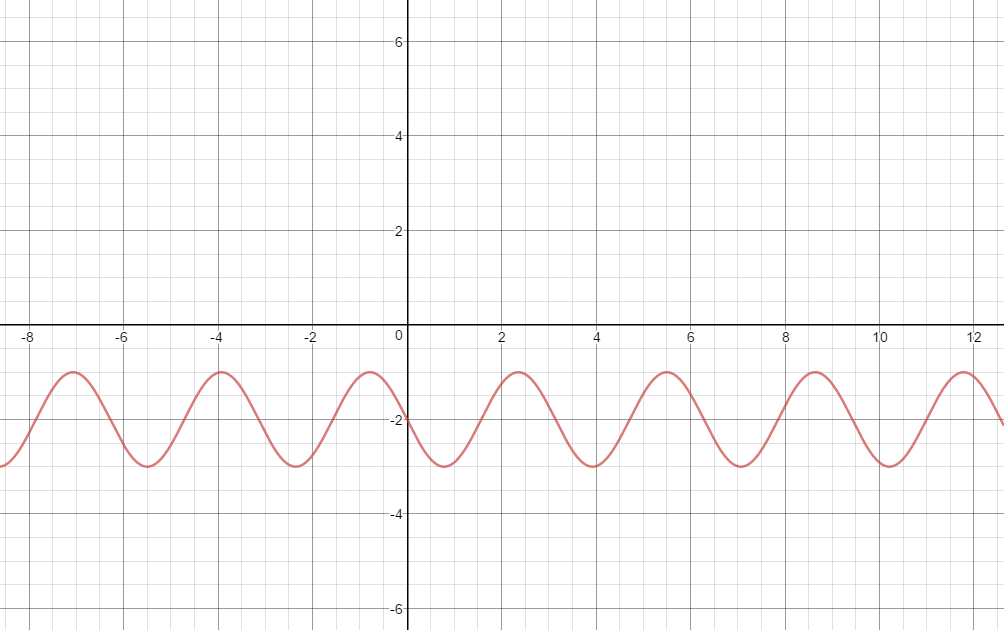
The -2 shifts the graph down 2 units, therefore, the graph will vary from -1 to -3.
The 2 multiplying the x makes the graph repeat 2 twice as fast as the normal sine function. Another way of saying this is, it changes the period from
The 2 multiplier, also, changes the phase shift; you divide the
Here is a graph of the function.