How do you graph #y=3x-4# using a table of values?
1 Answer

Nov 5, 2015
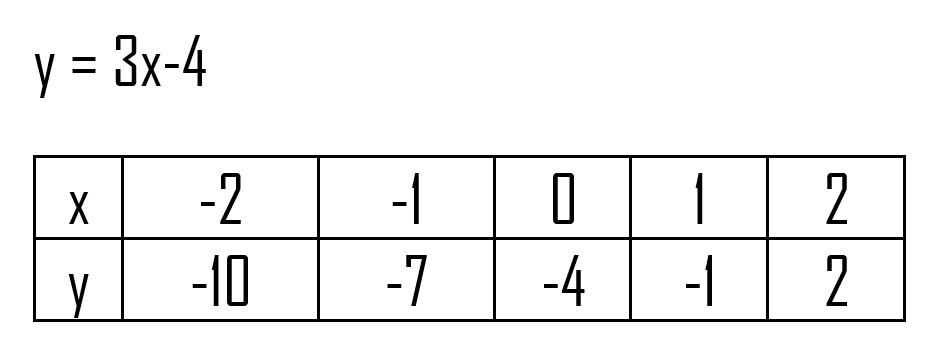
The values beside x will be plotted in the x-axis, and the values beside y will be plotted in the y-axis.
Explanation:
The values beside x will be plotted in the x-axis, and the values beside y will be plotted in the y-axis.
