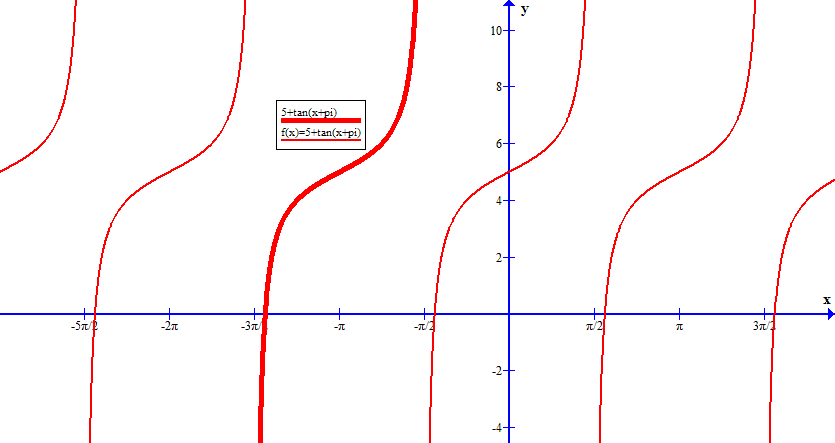
How do you graph y=5+tan(x+pi)?

1 Answer
Feb 13, 2017

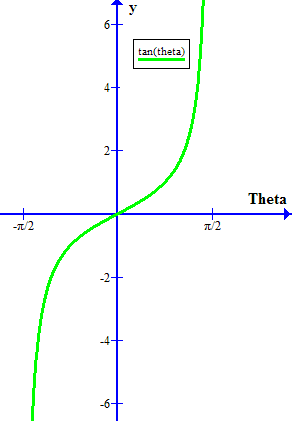
Start from a "basic cycle" for the tan function to obtain the results below.

Explanation:

Starting with the "basic cycle" for tan(theta) i.e. for theta in [-pi/2,+pi/2]
enter image source here

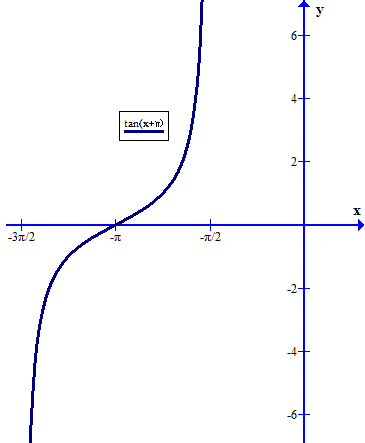
Then consider what values of x would place (x+pi) in this same range, i.e. (x+pi) in [-pi/2,+pi/2]
(Yes; I know: because tan has a cycle length of pi we could recognize that the cycle will repeat at exactly the same place, but let's do this for the more general case.)
(x+pi)in[-pi/2,pi/2]color(white)("X"rarrcolor(white)("X")x in [-(3pi)/2,-pi/2]
Giving us the "basic cycle" for tan(x+pi):
enter image source here

Adding 5 to this to get y=5+tan(x+pi) simply shifts the points upward 5 units:

In the image below, I have added the "non-basic cycles" as well as the "basic cycle" used for analysis:
enter image source here