How do you graph #y= 9(3)^(2x)# using a table of values?

1 Answer
Aug 5, 2018

#" "#
Please read the explanation.

Explanation:

#" "#
The function given

#color(red)(y=f(x)=(9)(3)^(2x)#

is an exponential function.

The parent function of the exponential function #color(blue)(y=a*b^x# has

base #color(red)(b# with exponent #color(red)(x#

y-intercept: #color(red)((0,a)#

Conditions:

#color(green)(b>0#

#color(green)(b!=1#

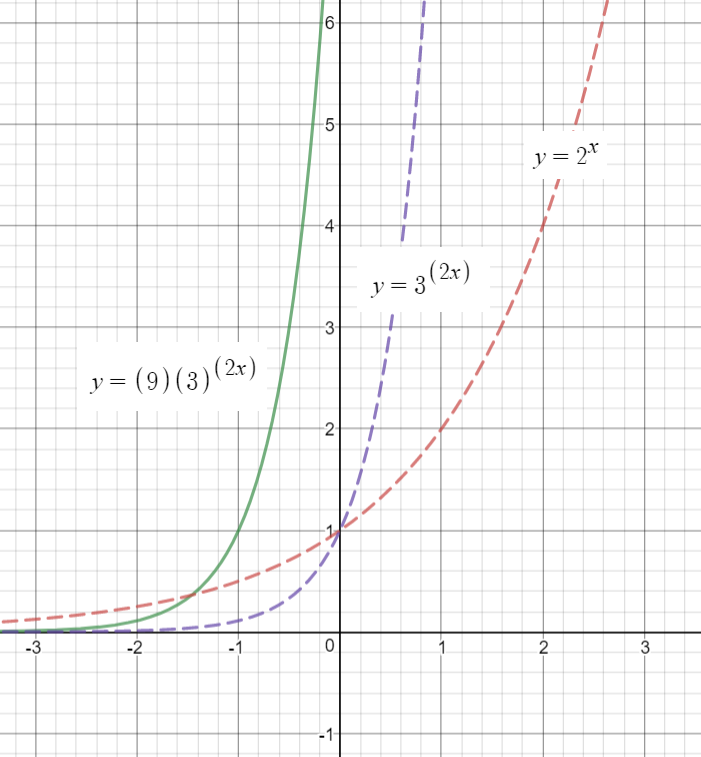
Values of #color(red)(x# are extremely small in the second quadrant close to the x-axis, but in the first quadrant you can observe the values of #color(red)(y# increase rapidly.

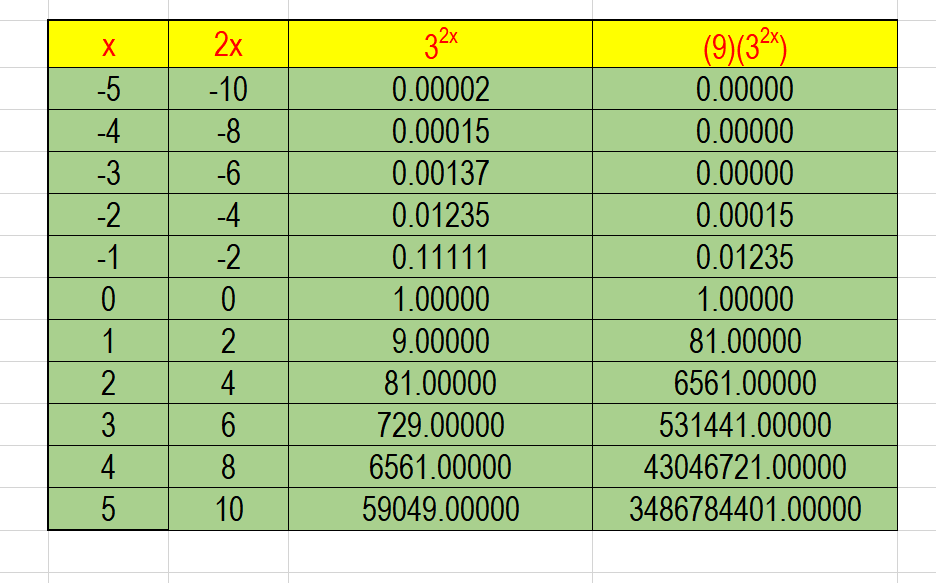
Data table is given below:

enter image source here

Graph of #color(red)(y=f(x)=(9)(3)^(2x)#:

You can also find the graphs of #y=3^(2x)# and #y=2^x# for comparison.

enter image source here

Hope it helps.