How do you graph #y=tan((1/2)x)#?
1 Answer

Please read the explanation.
Explanation:
Let us look at the standard form:
Period :
x-scale:
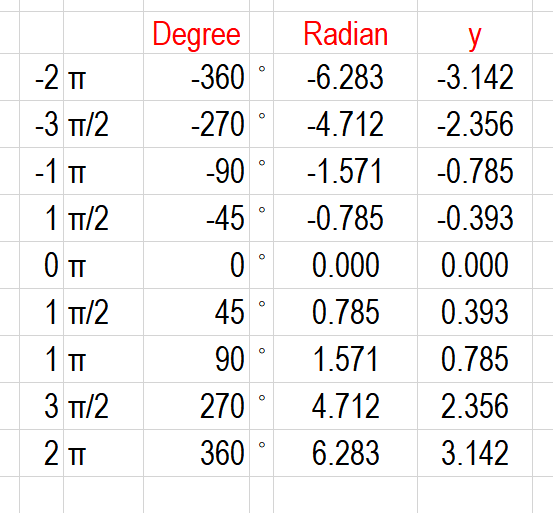
Let us look at the data table, with constraint
For the sake of focus and clarity contraint is used.
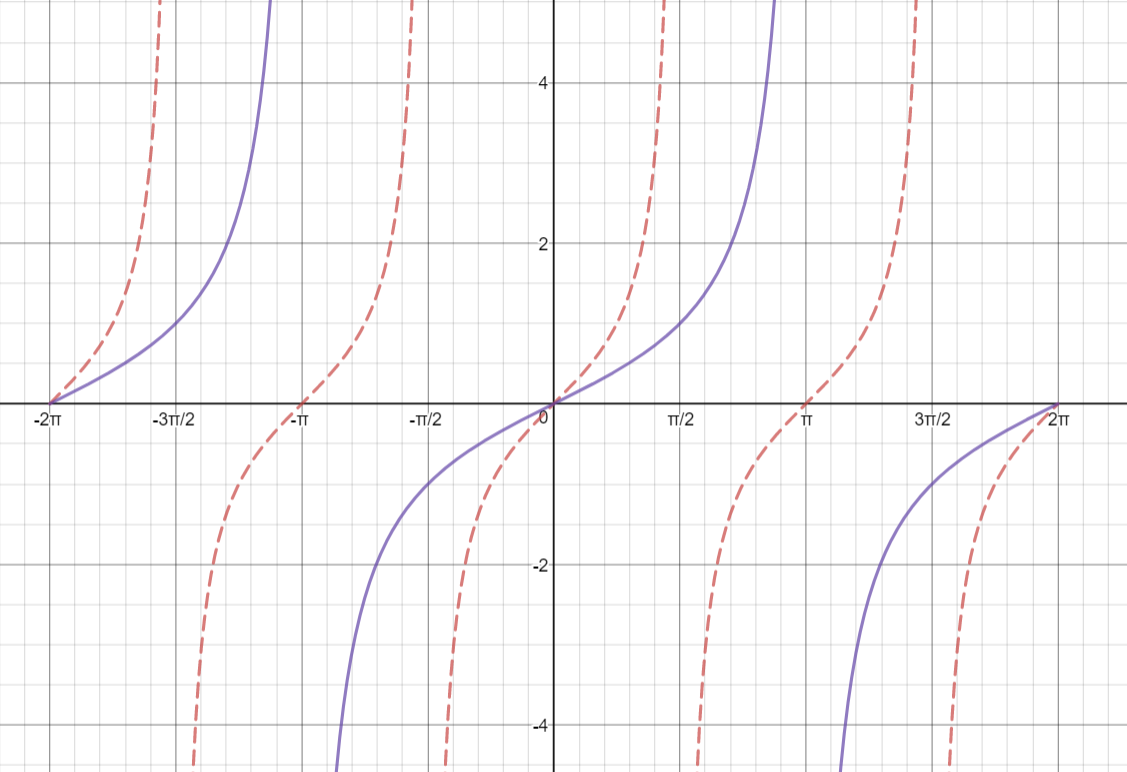
Graph the given trigonometric function:
Note:
-
Constraint
#-2 pi < x < 2pi # -
Parent graph of
#y=f(x)=tan(x)# is also available in color#color(red)("RED")# for comparison -
Graph of the given function
#y=f(x)=[tan(x/2)]# is in#color(blue)("BLUE"# -
x-intercepts : They happen within the periods of
#2pi#
i.e.,#(-4pi, -2pi,0, 2pi, 4pi)# etc
Hope you find this useful.
