How do you graph y=x-2?
1 Answer

Jan 22, 2016
Method of 'How' to graph is described in Explanation
Explanation:
You asked
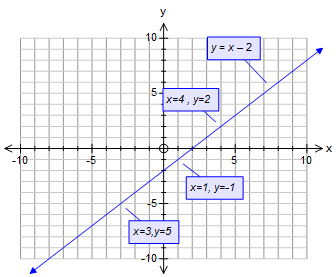
This is a strait line graph. In theory you only need to calculate 2 points and draw a line through them. I would suggest that 3 is better. If all 3 line up then you are very likely correct with your calculations. If they do not line up then check you numbers. You have gone wrong some where!
Project the x-values upwards. Project the y-values horizontally. Where they meet is the plotted point. Put a dot there.
Line all the dots up with a ruler and draw your line.
 Tony B
