How do you make a box-and-whisker plot of the data 77, 80, 76, 92, 86, 84, 72, 62, 93?
1 Answer

Oct 6, 2017
Look below :)
Explanation:
First you need to find out the minimum,
This is the exact way the box and whisker plot is set up.
Our values for them are as follow:
Minimum =
Median =
Maximum =
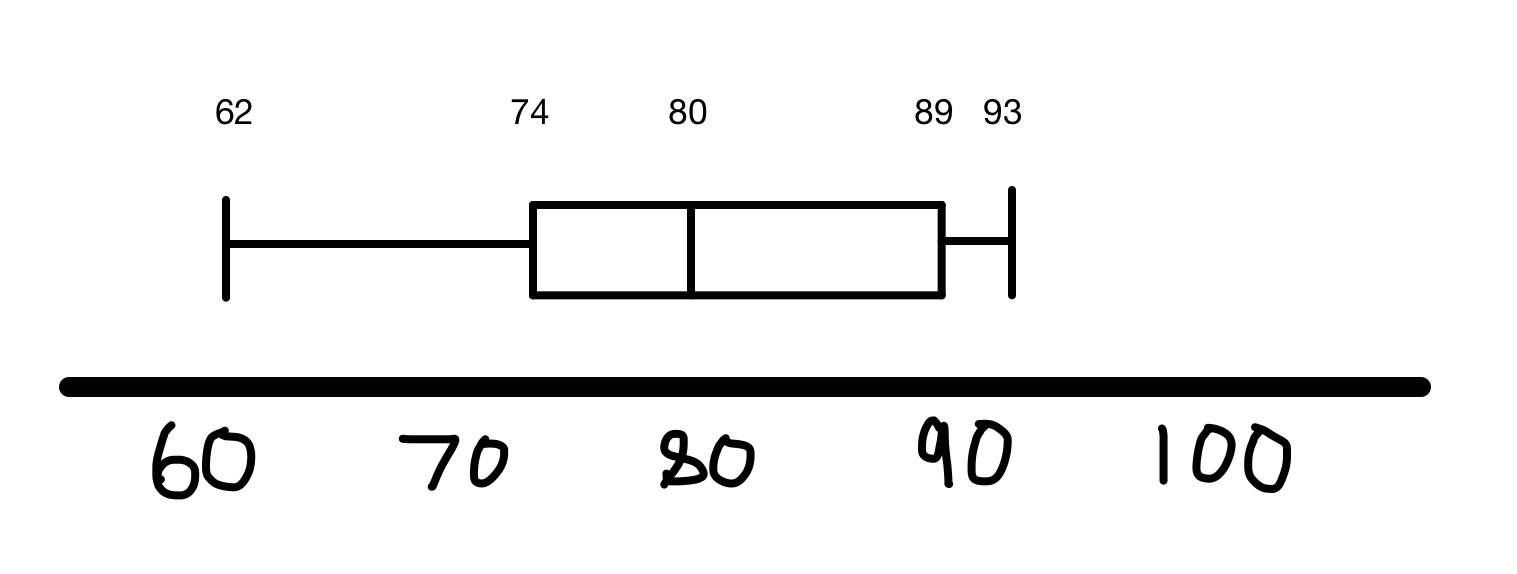
Each of them represent a line in the box and whisker plot.
It should look like this: