How do you make a Box and Whisker plot with the numbers: 60, 90, 90, 92, 100, 100, 100, 100?
1 Answer
See below.
Explanation:
To create a box-and-whisker plot, you need five values: the minimum, the
- The minimum value is
#60# . - The median can be calculated by finding the middle number out of the set. You must first arrange the numbers in order from least to greatest, but here they are already in this order.
In this case, there are two middle numbers:
#92# and#100# . To find the middle number, find the average of them.
#(92+100)/2 = 96# So, the median or
#"Q2"# value is#96# .
-
The maximum value is
#100# . -
The
#"Q1"# and#"Q3"# values are simply the medians of the two halves of our data.
#"Q1"# value (first quartile)Find the median of the lower half of the data, which is
#60, 90, 90, 92# .The two middle numbers are
#90# and#90# ; the average of these is#90# .
#"Q1" = 90#
#"Q3"# value (third quartile)Find the median of the upper half of the data, which is
#100, 100, 100, 100# .The two middle numbers are
#100# and#100# ; the average of these is#100# .
#"Q3" = 100#
Now that we have the five values we need, make a number line and draw lines where each value occurs.
Connect the middle three lines to form a box. This "box" is called the interquartile range because it consists of the
Finally, draw lines extending out from the box and connect them to the minimum values. These are the "whiskers".
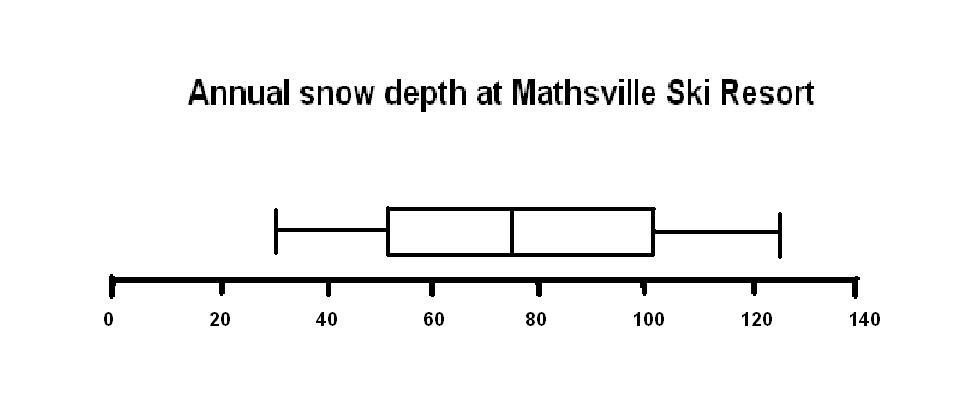
In the end, a box-and-whisker plot looks something like this:

However, since our


