How do you Plot (-9,5)?
1 Answer


See below:
Explanation:
Firstly, remember that points are written in the form
This is pretty confusing, so I'll show you some examples with pictures.
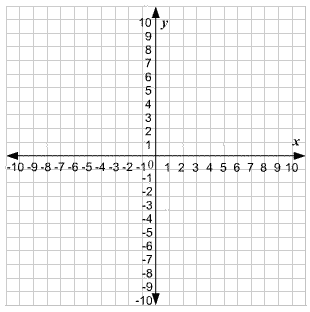
This is a typical graph. The
Your point is
Putting your finger on the 0, count to the left 9 spaces, to the -9 space. Since it is negative, we moved to the left. That is the placement on the
Now move your finger up 5 spaces, to the fifth vertical line. Because it is positive, we moved up. This is the placement on the
Draw a little dot right where your finger is. It should be right here: 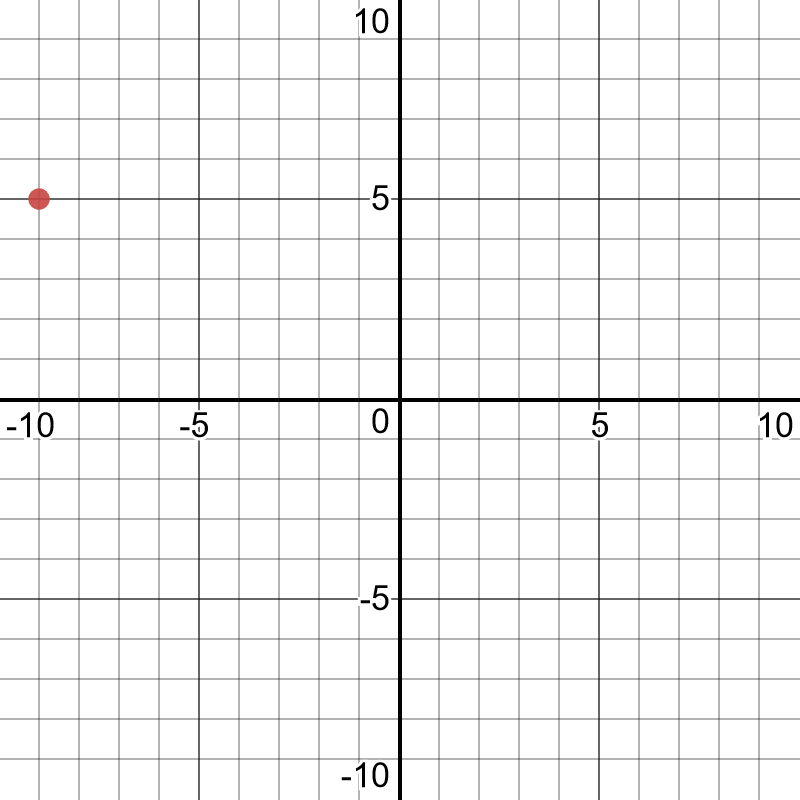
That is how you graph the point
*Note: This graph makes it look like the point is on
