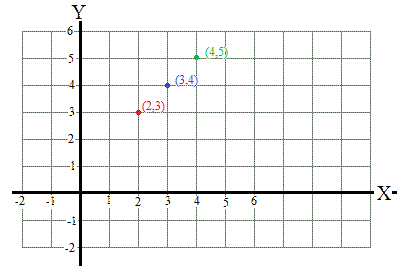
How do you plot points with coordinates (2, 3), (3, 4), and (4, 5) on a graph?
1 Answer
Jun 29, 2015
For each point the first value (x) gives the distance to the right of the Y-axis and the second value (y) gives the distance above the X-axis
Explanation:
Draw your graph with X (horizontal) and Y (vertical) axes; label coordinate distances along each axis from the point of axes intersection. For each given point the first value is the horizontal distance (x) and the second value is the vertical distance (y).

