How do you plot the points (4,1), (-2,3), (3,0) on the coordinate plane?
1 Answer

See solution process below
Explanation:
To graph points on a coordinate plane, we must be aware that points or coordinates rather are written in the form
To graph a point, we must first locate its position on the x-axis, then do the same for y-axis and find where the two points meet.
The way I might think about it is that the
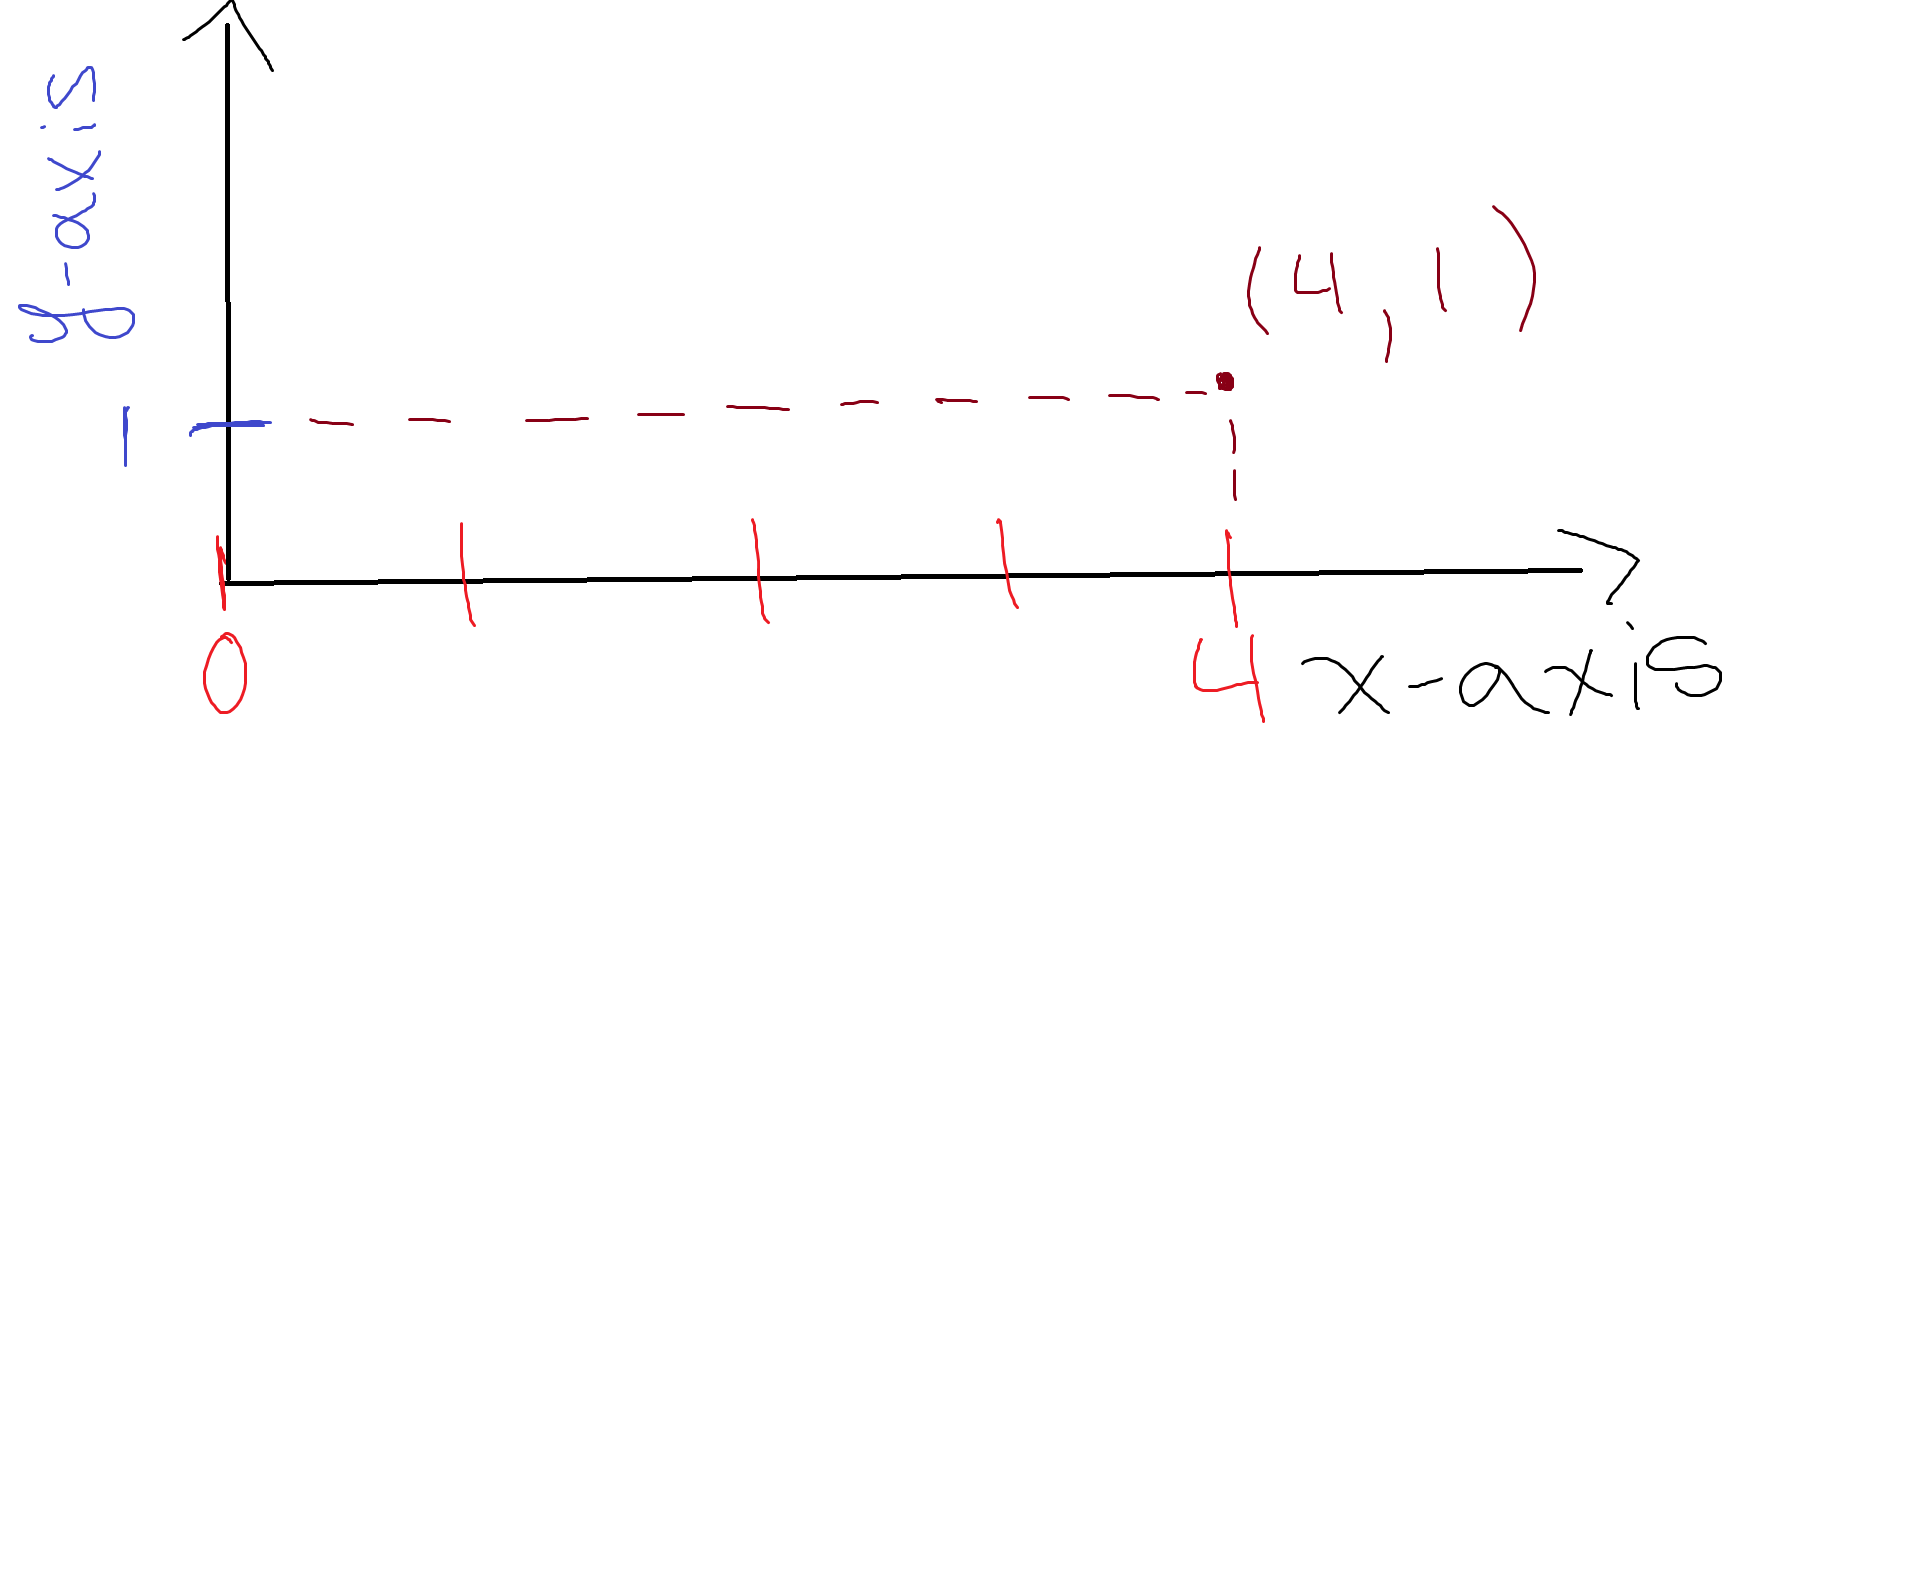
Beginning with the point
First locate the position of the
Next we locate the
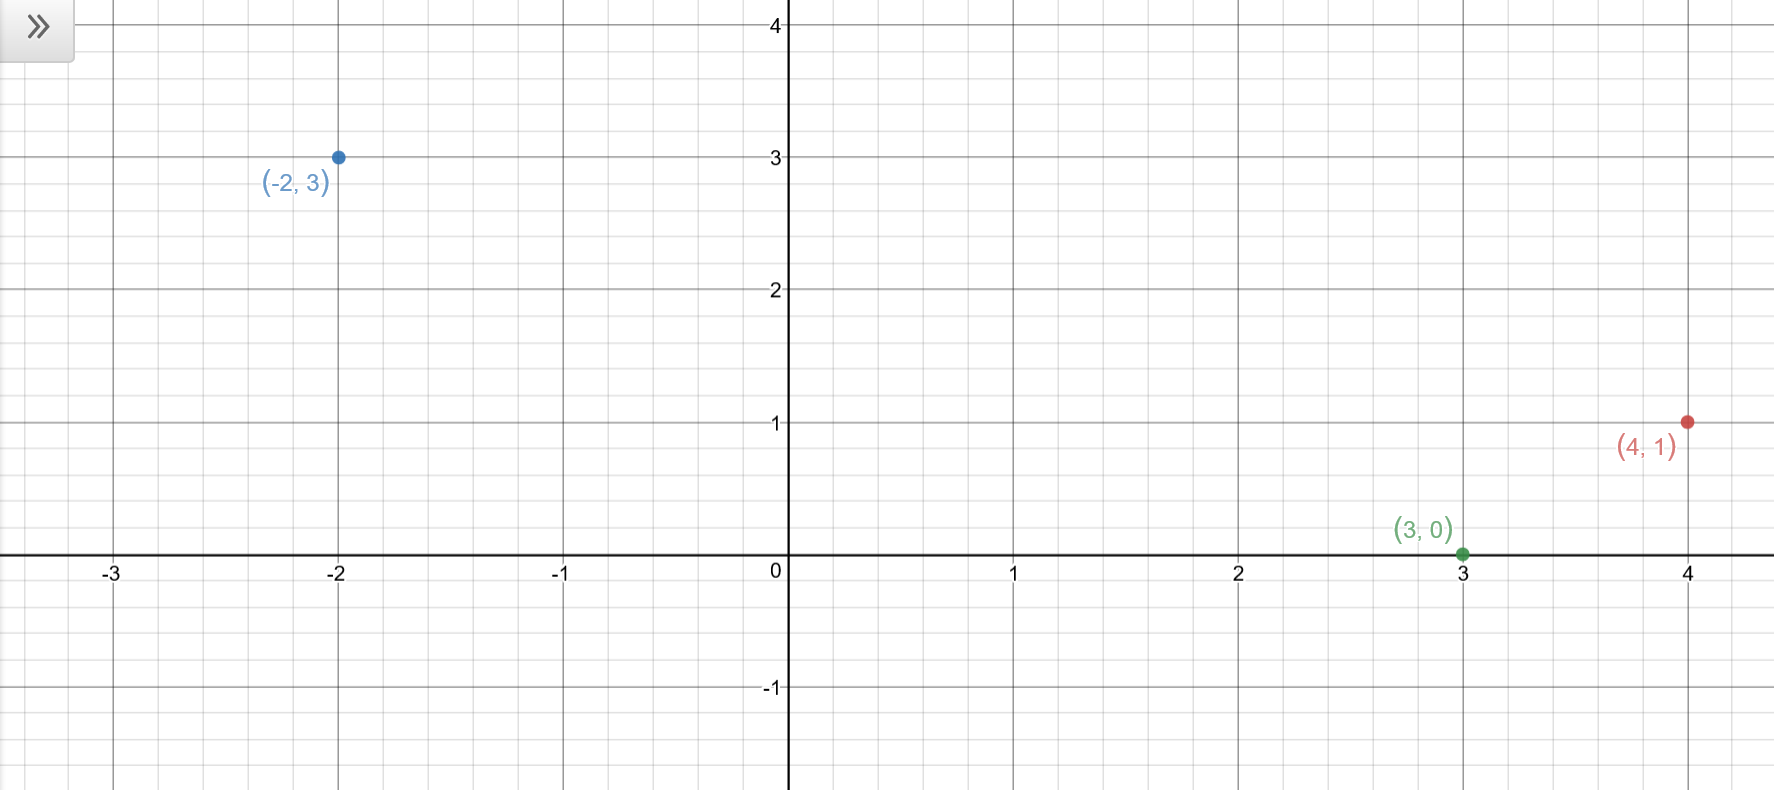
Follow these same steps for the other two coordinates and once completed, the coordinates should all look like this.