How do you use transformation to graph the sin function and determine the amplitude and period of #y=sin(x+pi/6)#?

1 Answer
Dec 3, 2017

See below.

Explanation:

If we look at a trig function in the form:

#y =asin(bx+c)+d#

Amplitude is #color(white)(888) color(blue)(a)#

Period is #color(white)(888)color(blue)((2pi)/b)#

Phase shift is #color(white)(888) color(blue)((-c)/b)#

Vertical shift is #color(white)(888)color(blue)(d)#

From: #y=sin(x+pi/6)#

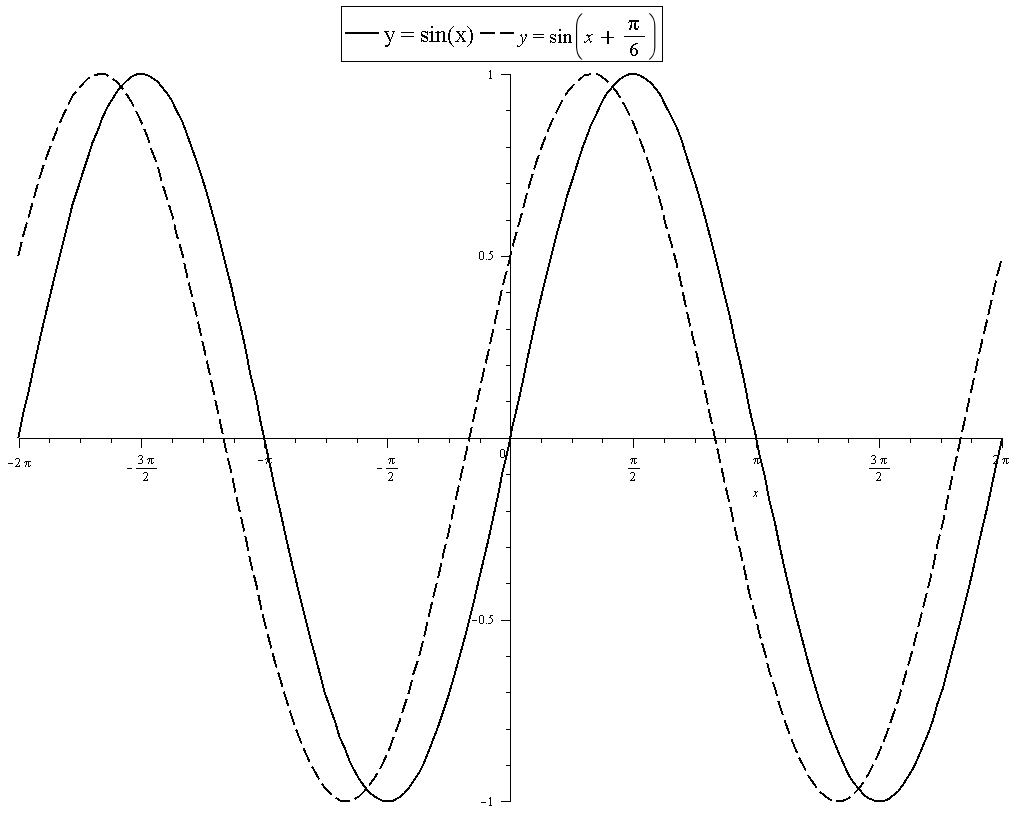
We can see amplitude is 1. This is the same as for #y=sin(x)#

The period is: #(2pi)/1=2pi#. This is the same as #y=sinx#

Phase shift is: #(-pi/6)/1=-pi/6# This translates the graph of

#y=sinx# #color(white)(88) pi/6# units to the left.

From the above, we conclude that the graph of #y=sin(x+pi/6)# is the graph of #y=sinx# translated #pi/6# units to the left.

Graph of #y=sin(x+pi/6)# and #y=sinx# on the same axes:

enter image source here