How does weather forecasting utilize statistics and probability?
1 Answer
Smoothing or rounding.
Explanation:
Look at a weather map.
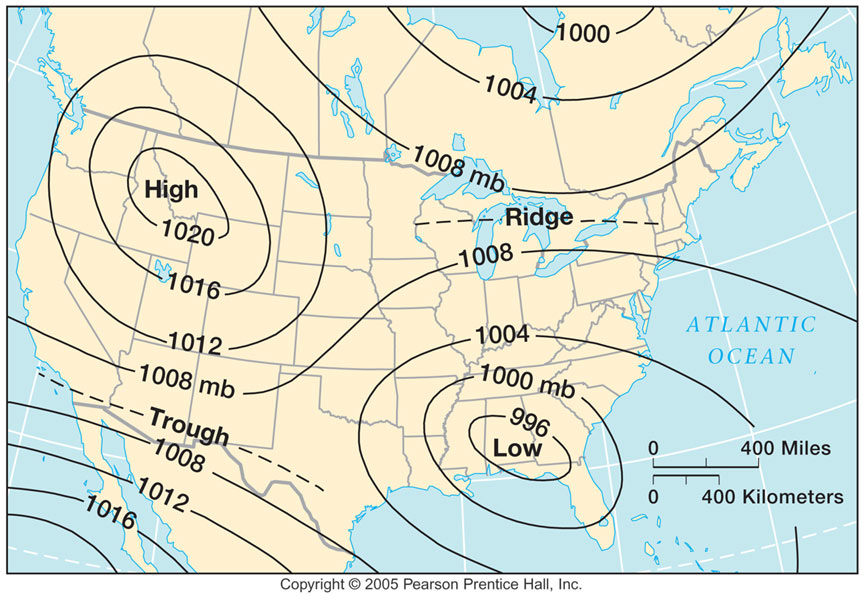
Those lines are isobars, or lines of equal pressure. However we do not measure pressure over every location. So the lines are actually connecting points of equal pressure and not every point on the line are we certain is the same pressure. In this case the line is an average, and not only that but the computer will "smooth" that line out if necessary to make it fit what we normally expect an isobar to look like (it is going to take out sharp turns and bumps). We don't just do pressure like this, temperatures (isotherms) are also rounded as are many other variables.
When determining what a high or low pressure is going to do we look at the different factors effecting it. Things like advection and vorticity. These things are going to cause divergence or convergence on the surface and aloft. To determine if these factors are going to cause a high to build (get stronger) or weaken or a low to deepen (get stronger) or fill (weaken), we have to consider probability that those factors are remaining the same or if they are likely to change.
If we were willing to pay vast amounts of money we could measure all the variables at so many sites that weather prediction would become almost always correct. As that cost is not feasible, we are forced to use statistics to make up for the missing data. This, by the way, creates what is referred to as "chaos theory".
