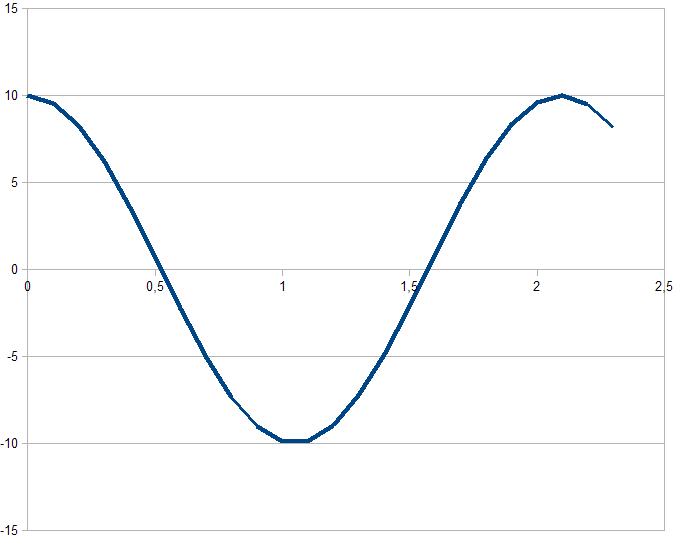
How to plot the graph of f(x)= 10 cos 3x?
1 Answer

Jul 1, 2015
Your function is a cosine function with amplitude
Explanation:
The graph of your function is the same as the one from a "normal" cosine BUT:
1] Amplitude will be
2] Period will be:
Graphically:
graph{10(cos(3x)) [-28.88, 28.86, -14.43, 14.45]}
Where you can see the outline of a normal
I add another plot, easier to "see" (I hope!):