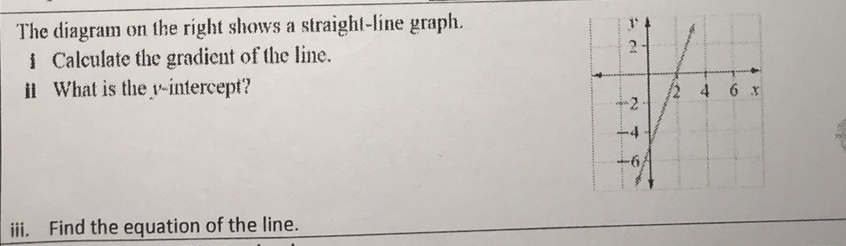
Please help with the image below.(?)
2 Answers

I tried this:
Explanation:
You can see the
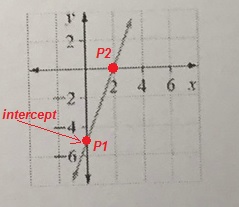
So the intercept will be the point
The slope
where we used two points
The equation of the line can be found remebering its general form (using for example the coordinates of point
giving:
Explanation:
"the gradient is a measure of ""change in y"/"change in x"=(Deltay)/(Deltax)
"we require to have 2 points on the line "
(2,0)" and "(0,-5)" are 2 points on the line"
"note that "y=-5color(red)" is the y-intercept"
"gradient (m) "=5/2
"the equation of a line in "color(blue)"slope-intercept form " is.
•color(white)(x)y=mx+c
"where m is the gradient and c the y-intercept"
"here "m=5/2" and "c=-5
y=5/2x-5larrcolor(red)" is the equation of the line"
