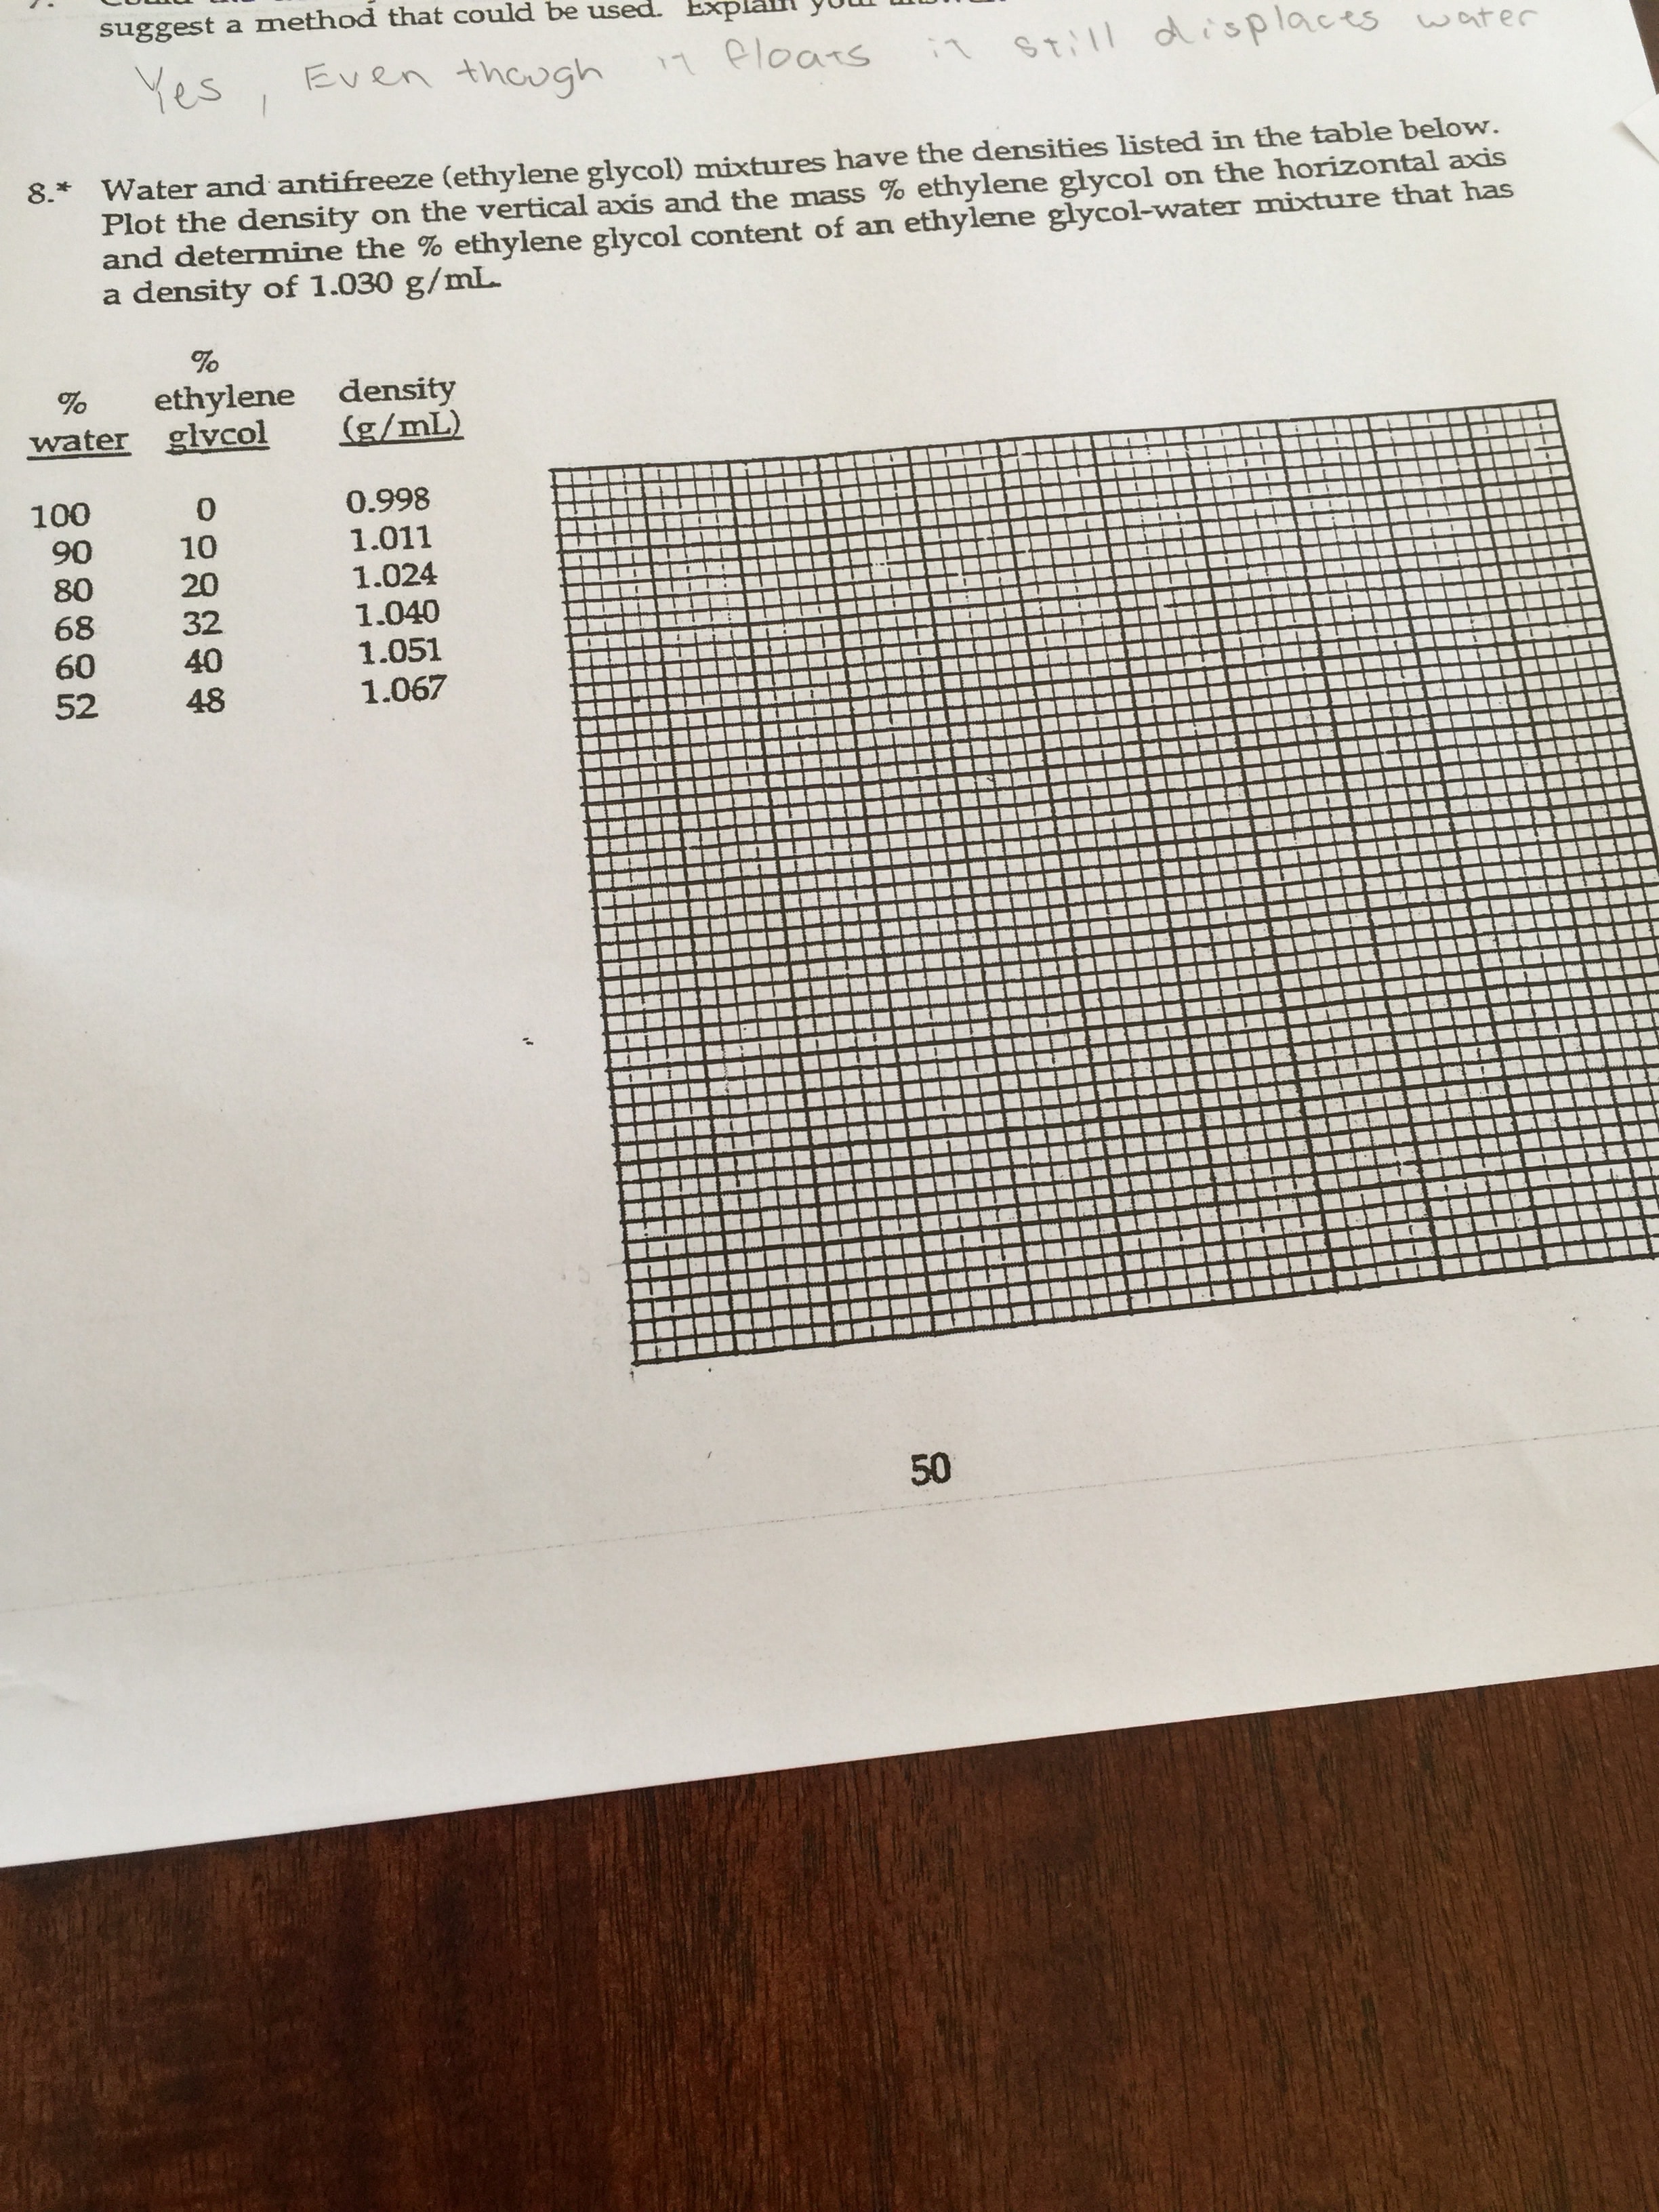
Plot the density on the vertical axis and the mass % ethylene glycol on the horizontal axis and determine the % ethylene glycol content of an ethylene glycol-water mixture that has a density of 1.030 g/mL. Could you post a picture of the chart?
1 Answer

Well, you might be able to rationalize this conceptually...
-
The presence of ethylene glycol can be seen to increase the density of the solution.
-
Given the data, if the density is between
#"1.024 g/mL"# and#"1.040 g/mL"# and closer to#"1.024 g/mL"# than#"1.040 g/mL"# , then the percentage of ethylene glycol, which is more dense (from the first rationale above), should be closer to#20%# than#32%# .
And in fact, we got
Well, I would convert the percentages to a mol fraction, and just do it based on the mol fraction of just water (

Here we assume the ethylene glycol and water make an ideal solution so that the slope of this graph is approximately linear.
Alternatively you could have done it using the mol fraction of ethylene glycol by subtraction (
And thus, an alternative graph is:
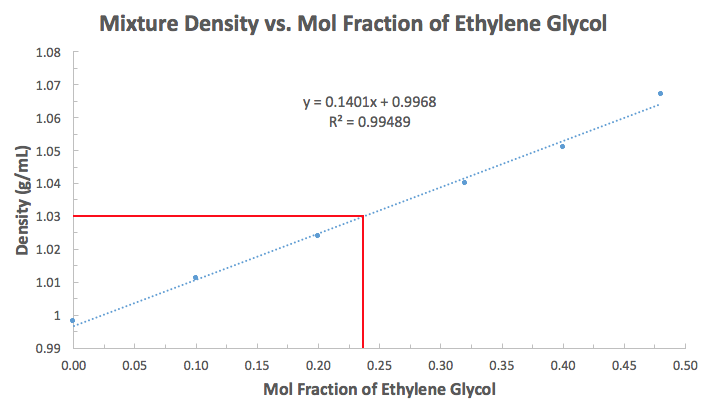
Either way, you would be able to get this from the fit-line equation. Since
#chi_(EG) = 1 - chi_(w)#
#= 1 - (D - 1.1369)/(-"0.1401 mL/g")#
And since we want to find when the density is
#chi_(EG) = 1 - ("1.030 g/mL" - "1.1369 g/mL")/(-"0.1401 mL/g")#
#= 0.2370#
which is
