See below (It's about trigonometric functions) Please answer and explain this?
The London Eye has a maximum height of 135 meters, it contains 32 closed cabins, it turns at a constant speed and it takes 30 minutes for one complete tour.
Suppose that the height #h(t)# (in meters) of a cabin of the London Eye as a function of the time #t# (in minutes) can be written as #h(t)=a+bcos(ct)# with #a# , #b# and #c# constants. At time #t=0# the cabin should start at the bottom.
-
Use the data above to find the coefficients #a# , #b# and #c# .
For #c# , work in radians. Give exact answers.
-
What is the speed of a cabin of the London Eye in meters per second?
For question 1, this is what I have so far :
#h(0)=a+b#
#h(7.5)=a+b*cos(c*7.5)#
#h(15)=a+b*cos(c*15)#
The London Eye has a maximum height of 135 meters, it contains 32 closed cabins, it turns at a constant speed and it takes 30 minutes for one complete tour.
Suppose that the height
-
Use the data above to find the coefficients
#a# ,#b# and#c# .
For#c# , work in radians. Give exact answers. -
What is the speed of a cabin of the London Eye in meters per second?
For question 1, this is what I have so far :
1 Answer

As per problem the movement of the London Eye is periodic one and its height at
Here
Hence
So the equation[1] takes the following form
Now at
Applying this condition on [2] we get
Since at
then we can say that at
So we can write
Now adding [3] and [4] we have
Subtracting [4] from [3] we get
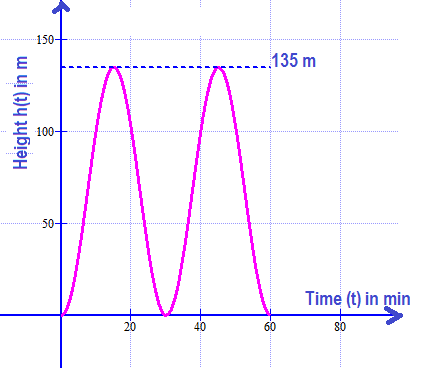
So finally the given equation takes the following form
The variation of height with time can be represented by following graph.