Sketch the graph of pV vs p when the temperature of the gas is constant. here p means pressure and V means volume - showing you the direct relationship b/w p and V (by using pV). how to sketch it???
1 Answer
We know that the Ideal gas equation is
where
Since temperature is kept constant the RHS of the equation is a constant.
As such the graph of
We can test this by plotting
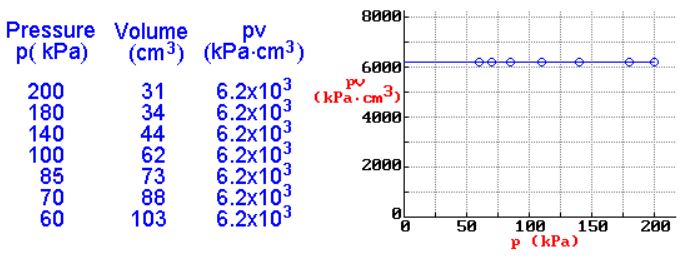
The computer gives the equation for the best fit line as
This implies that the line starts at
Using only two significant figures for the
Therefore, within the limits of experimental error,
