The graph of #3x-7y+11=0# crosses the y axis at which point?

1 Answer
Mar 15, 2018

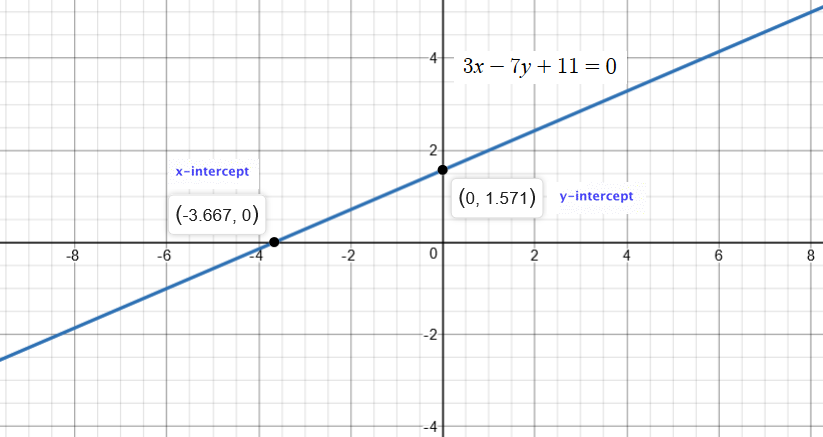
The graph of #color(red)(3x-7y+11=0# crosses the y axis at #color(blue)((0, 1.571)#

Explanation:

Find where the graph of #color(red)(3x-7y+11=0# crosses the y axis.

The intercepts of a line are the points where the line intercepts, or crosses, the horizontal and vertical axes.

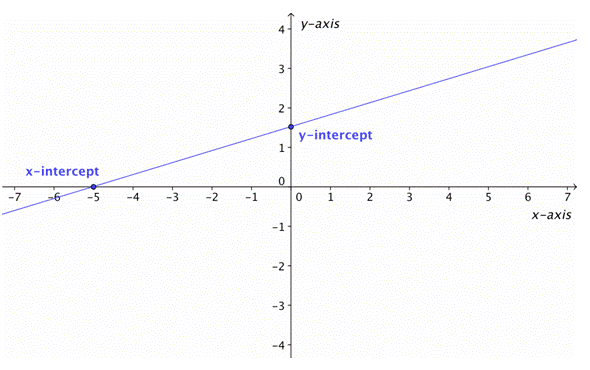
The straight line on the graph below intercepts the two coordinate axes.
enter image source here

The point where the line crosses the x-axis is called the x-intercept.

The y-intercept is the point where the line crosses the y-axis.

Observe that the y-intercept occurs where #x = 0#, and the x-intercept occurs where #y = 0#.

Consider the given equation

#3x-7y+11=0#

Add #color(brown)(7y# to both sides of the equation, to get

#rArr 3x-7y+11+color(brown)(7y)=0+color(brown)(7y)#

#rArr 3x-cancel(7y)+11+color(brown)(cancel(7y)=0+color(brown)(7y)#

#rArr 3x+11=7y#

#rArr 7y=3x+11#

Substitute #x=0# to get

#7y=3(0)+11#

#7y=11#

#y=11/7 or y ~~ 1.571428571#

Hence,

#color(blue)(y=(0, 1.571)# is the required y-intercept.

Hence, we can conclude that the graph of #color(red)(3x-7y+11=0# crosses the y axis at #color(blue)((0, 1.571)#

Examine the image of the graph below for better comprehension:
enter image source here

Additional information:

x-intercept occurs where #y = 0#.

If you substitute #y=0# in the given equation, you can get the x-intercept.