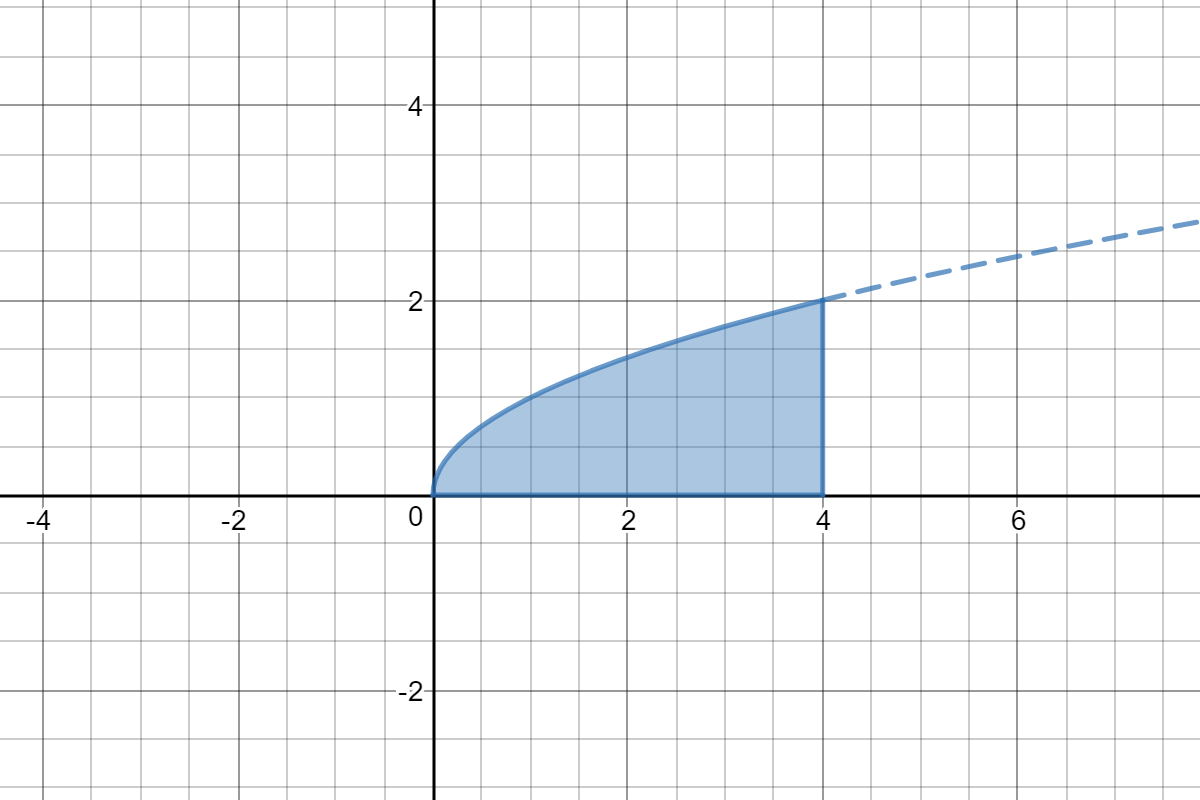
The region under the curve #y=sqrtx# bounded by #0<=x<=4# is rotated about a) the x axis and b) the y axis. How do you sketch the region and find the volumes of the two solids of revolution?
1 Answer

May 19, 2017
See below
Explanation:
To graph the region:
sketch the curve
Restrict the domain to
use the
Shade in the regione under the curve
Revolve about the
Use disks.
# = pi[x^2/2]_0^4#
# = 8pi#
Revolve about the
Use shells.
# = 2pi[(2x^(3/2))/3]_0^4#
# = (32pi)/3#
