The region under the curves #y=sqrt(e^x+1), 0<=x<=3# is rotated about the x axis. How do you sketch the region and find the volumes of the two solids of revolution?

1 Answer
Dec 13, 2017

Please see below. (There is only one solid.)

Explanation:

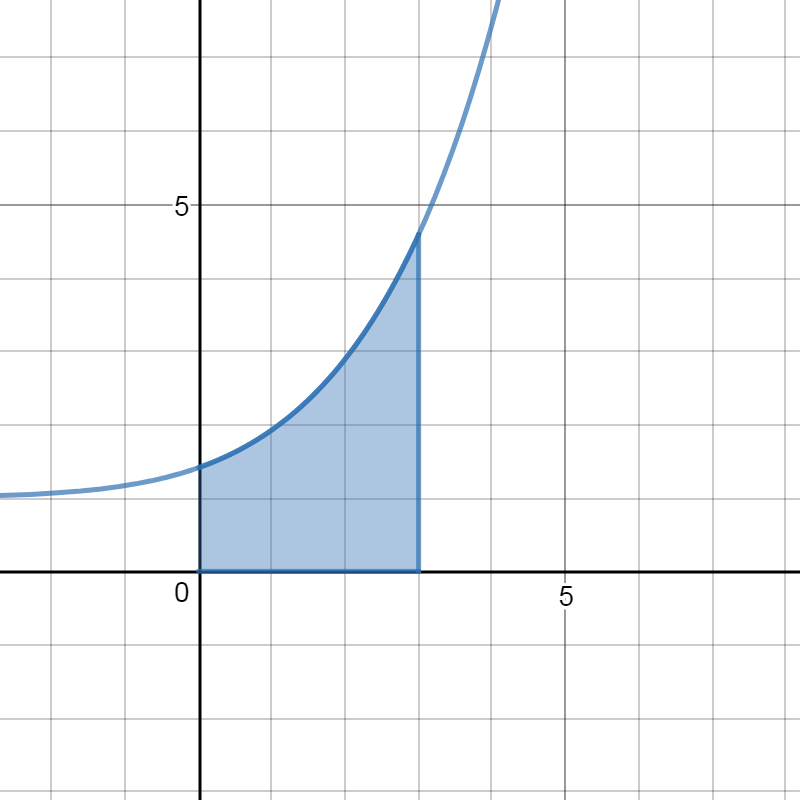
To sketch #y = sqrt(e^x+1)# note that the #y# intercept is #sqrt(2) ~~ 1.4#.

And at #x=3#, we have #y= sqrt(e^3+1)# which is close to #4.5#.

Arithmetic approximation:
(#e~~2.7# so #e^3 ~~ 2.7^3#. now, #2.7 * 2.7 ~~7.3# and #2.7 * 7.3 ~~19.7#. So #e^3 +1# is near #21# and #4.5^2 = 20.25# since #(n+0.5)^2 = n(n+1) +0.25#.)

The derivative: #y' = e^x/(2sqrt(e^x+1))# is always positive, so the function is increasing.

(For a better sketch investigate concavity. The graph is concave up.)

The region is shaded blue.
enter image source here

To go around the #x# axis, I used disks.

The volume of a representative disk is

#pi("radius")^2 xx "thickness" = pi(sqrt(e^x+1))^2 dx = pi(e^x+1) dx#

Since #x# varies from #0# to #3#, the volume of the solid is

#V = pi int_0^3(e^x+1) dx = pi[e^x+x]_0^3 = pi(e^3+2)#