What are the important features of the graphs of quadratic functions?
1 Answer

A quadratic function has the general form:
(where
The main features of this curve are:
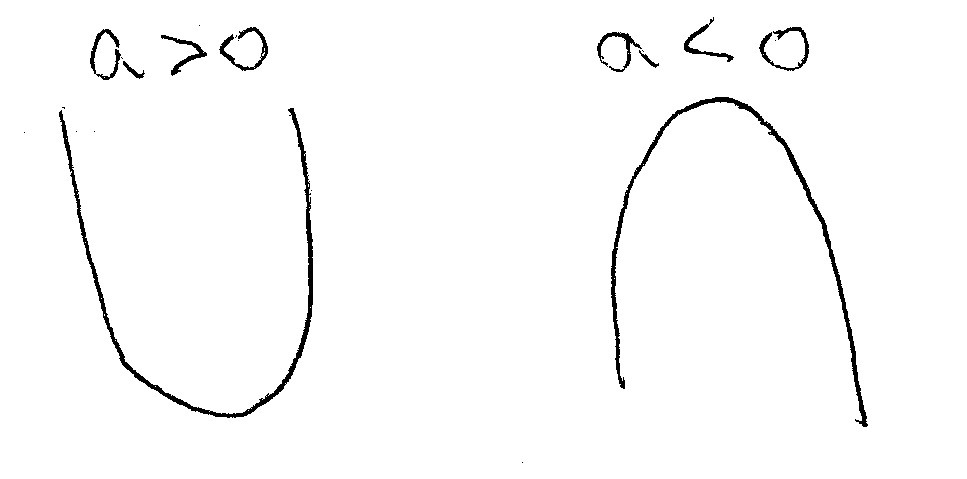
1) Concavity: up or down. This depends upon the sign of the real number
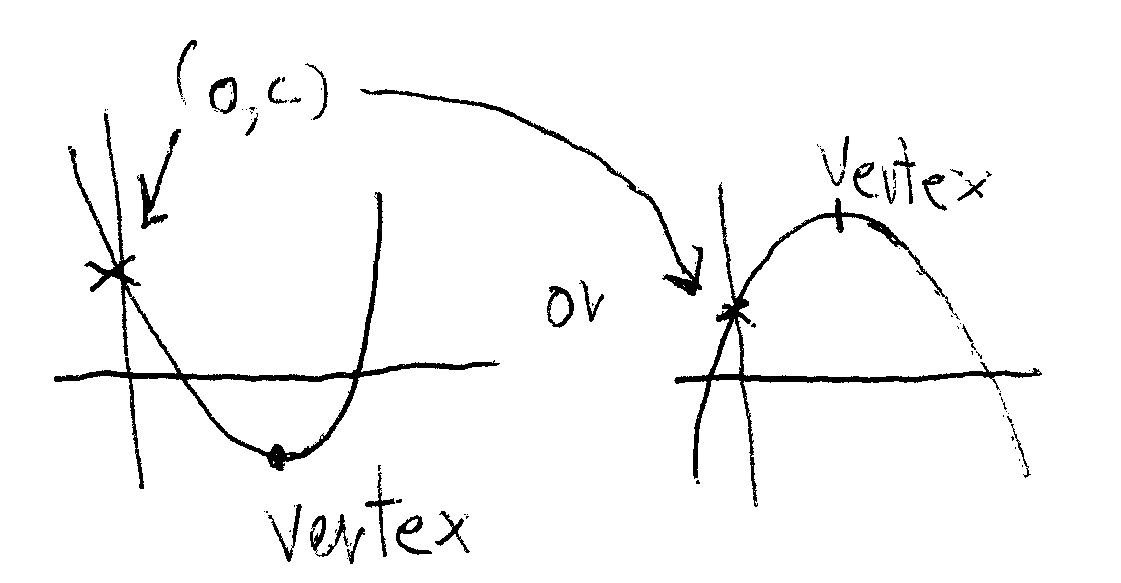
2) Vertex. The vertex is the highes or lowest point of the parábola.
the coordinates of this point are:
Where
3) point of intercept with the y axis. This is the point where the parábola crosses the y axis and has coordinates:
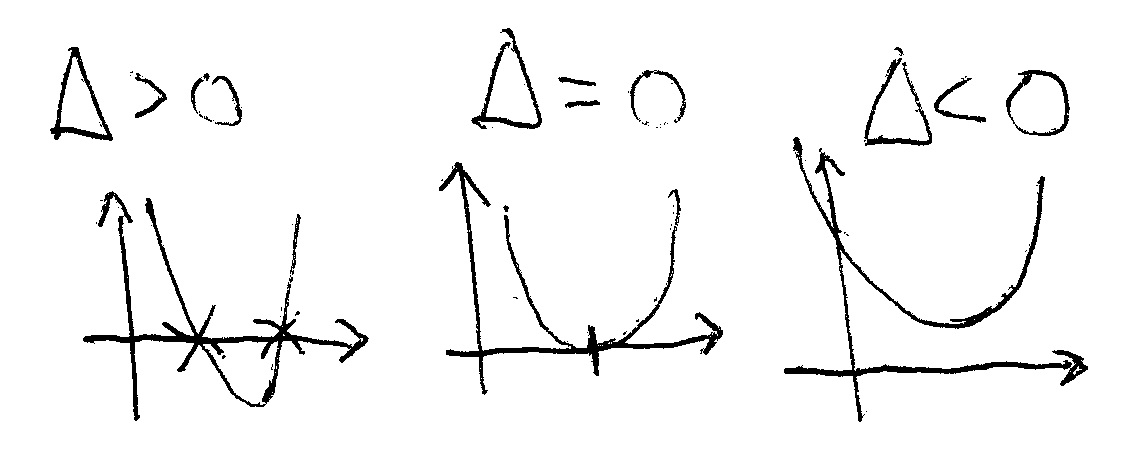
4) Possible points of intercept with the x axis (there also can be none). These are the points where the parábola crosses the x axis.
They are obtained by putting y=0 and solving for x the 2nd degree equation:
Depending on the discriminant