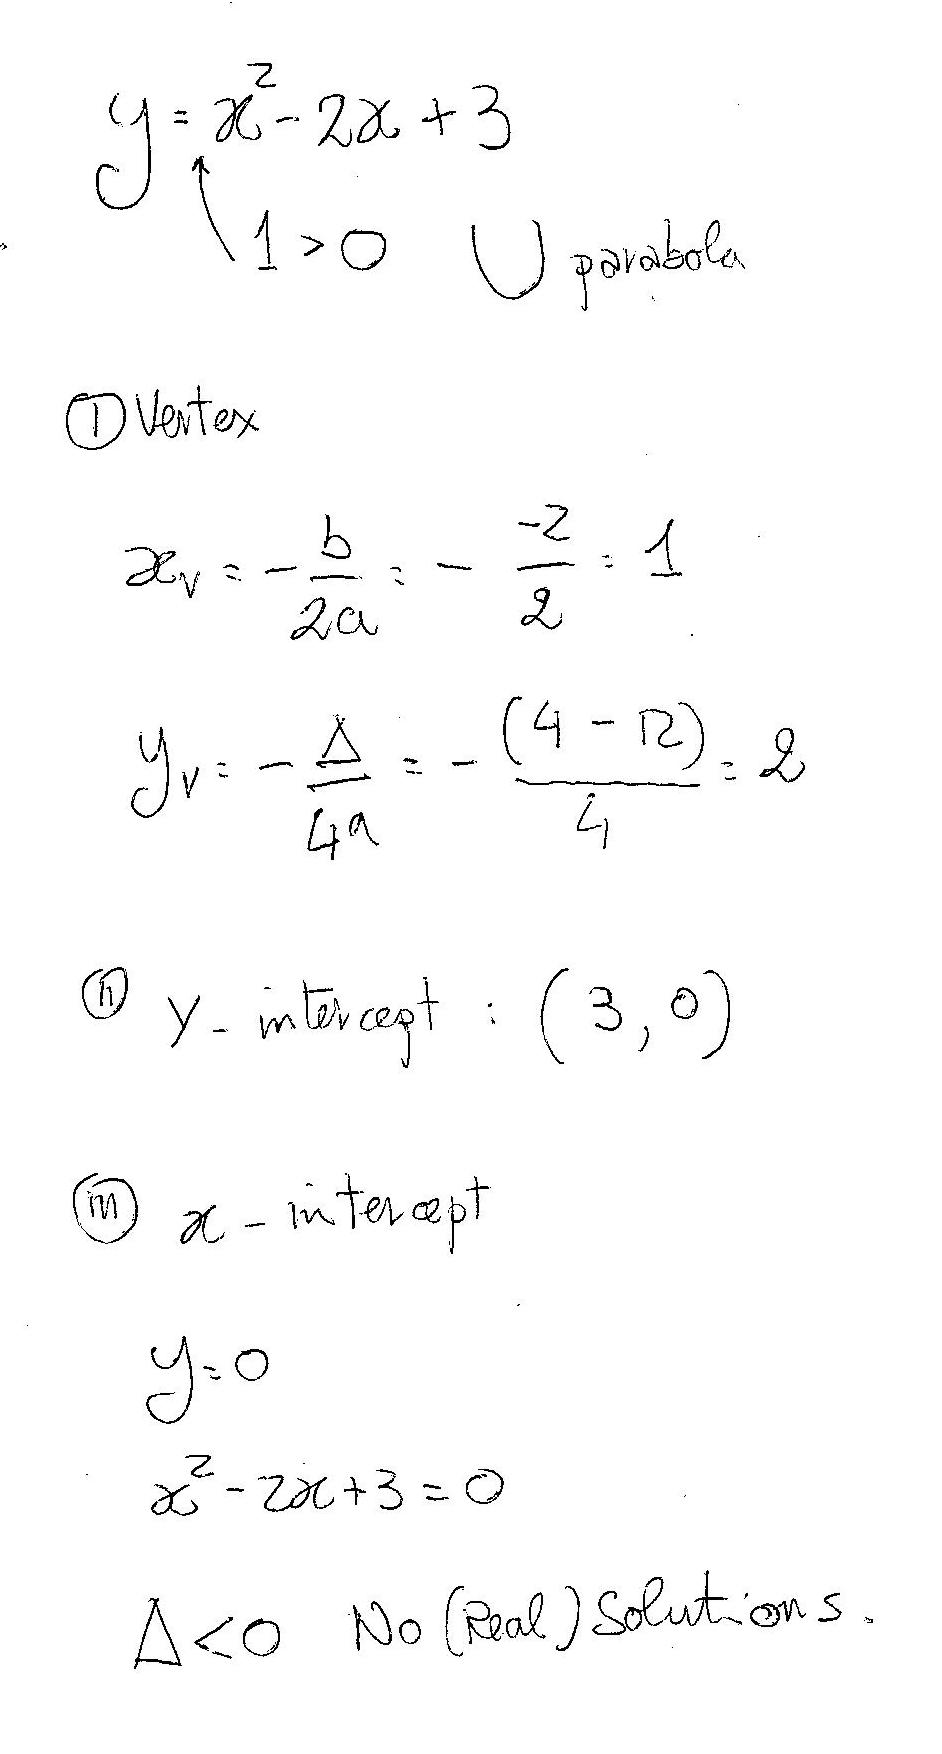
How do you graph #y=x^2-2x+3#?
1 Answer
You can look at the "special" points of your function. These are points that characterize the curve represented by your function.
In your case you have a quadratic in the general form given as:
which is represented, graphically, by a PARABOLA. The orientation of the parabola is given by the coefficient
Now the special points:
1) You find the VERTEX (the lowest point of your parabola) which has coordinates given by:
(Where
2) Y-axis intecept: The coordinates of this pont are given as:
3) X-axis intercept(s): the coordinate of these intercepts (if they exist) are given by putting
In your case you have:

With only these points we can already plot our parabola:

