What is a 3D phase diagram?
1 Answer

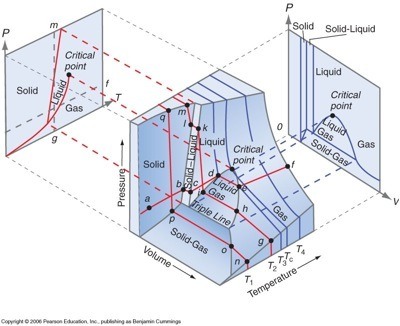
A 3D phase diagram is a type of graph in which three different conditions (such as
Explanation:
It shows the conditions at which different phases occur and coexist at equilibrium.
The equilibrium conditions are shown as curved surfaces in 3D, with areas for solid, liquid, and vapour phases and areas where two or three phases can coexist in equilibrium.
For example, a
 www.physics.utoronto.ca
Each surface shows the conditions at which two phases can exist in equilibrium.
A line on the surface where solid, liquid and vapor can all coexist in equilibrium is called a triple line.
The critical point remains a point on the surface, even in a 3D phase diagram.
A projection onto a plane parallel to the
Parallel to the
Here's a great video on 3D
