What is a box plot and why are they used?
1 Answer
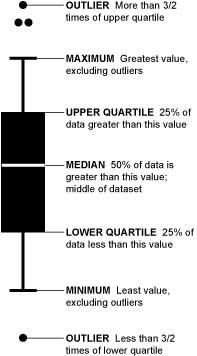
The box-and-whisker plot is an exploratory graphic, created by John W. Tukey, used to show the distribution of a dataset (at a glance).
Explanation:
The box-and-whisker of course shows you more than just four split groups. You can also see which way the data sways. For example, if there are more people who eat a lot of burgers than eat a few, the median is going to be higher or the top whisker could be longer than the bottom one. Basically, it gives you a good overview of the data’s distribution.

https://flowingdata.com/2008/02/15/how-to-read-and-use-a-box-and-whisker-plot/
Great tutorial here:
https://www.khanacademy.org/math/probability/data-distributions-a1/box--whisker-plots-a1/v/reading-box-and-whisker-plots
Another approach here:
http://onlinestatbook.com/2/graphing_distributions/boxplots.html
Excel Guide to making your own:
https://peltiertech.com/excel-box-and-whisker-diagrams-box-plots/

