The following graph represents the phase behaviour of water under differing regimes of pressure and temperature.
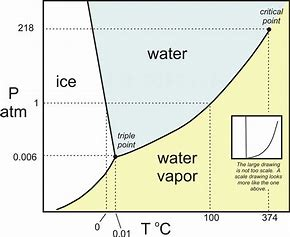
Now for the transition ice to water...we consider #(dP)/(dT)#...and this slope CLEARLY is negative (even tho I think this diagram exaggerates the slope)....and consider the Clapeyron equation for phase transitions...
#(dP)/(dT)=(DeltaS)/(DeltaV)# (this is derived from several state postulates, and at the moment I simply ask you to accept its formulation)…
And if #(dP)/(dT)# is negative, #(DeltaS)/(DeltaV)# IS ALSO NEGATIVE... Capisce? But #DeltaS# for a solid to liquid transition IS CLEARLY POSITIVE. And thus #DeltaV# is NEGATIVE...i.e. the SOLID PHASE, the ICE, OCCUPIES MORE VOLUME than the liquid phase. This is quite an unusual phenomenon, with the result that ice-cubes, and ice-bergs, FLOAT IN WATER in that they are less dense. And I think this is the result you are asked to consider....