Two-Way Tables
Key Questions
-
If you are given a pmf =
#p_(XY)(x,y)# and you would like to find the marginal
#p_Y(y)# we would use the formula
#p_y(y) = sum_ip(x_i,y)# in other words you would sum over all of
#x# at the point#y# 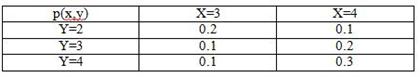
So if we look at this table and want to find the marginal
#p_Y(3)# we go:
#p_Y(3) = P( Y = 3)#
# = P(Y = 3, X = 3) + P(Y = 3, X=4)#
#= 0.1 + 0.2#
#=0.3# Now to look at the formula for the conditional probability
we can look at the formula for
#x# given#y# which is a conditional probability.#p_(X|Y)(x|y) = P(X = x_i | Y = y_j) = (P(X = x_i, Y= y_j))/(P(Y = y_j))# #=(p_(XY)(x_i,y_j))/(p_Y(y_i))# now to use an example, we will look back at our table.
let us look for the conditional probability of:
#p_(X|Y)(3|4) = 0.1/0.4 = 0.25# Thus, the probability that
#X = 3# given that#Y=4# is#0.25# Miles A. · 1 · May 18 2015
-
A two-way table is a display of data divided into two different categories of subsets.
In the example below, the categories are
age range: with subsets for ages 0-5, 6-10, and 11-15
color preference: with subsets for various color choices
The entry at D5 (value 8) indicates that 8 children in the age range 6-10 chose yellow as their preferred color.
The sum of values across a line indicates the number of children who chose the color for that line across all age ranges.
The sum of values down a column indicates the number of children surveyed in the corresponding age range.
Alan P. · 1 · Feb 17 2015