How can I graph Charles' law?
1 Answer

Charles's law (also known as the law of volumes) is an experimental gas law which describes how gases tend to expand when heated. A modern statement of Charles's law is:
When the pressure on a sample of a dry gas is held constant, the Kelvin temperature and the volume will be directly related.
this directly proportional relationship can be written as:
V
where:
V is the volume of the gas
T is the temperature of the gas (measured in Kelvin).
k is a constant.
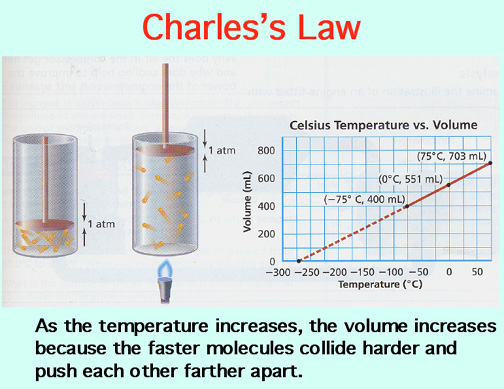
This law describes how a gas expands as the temperature increases; conversely, a decrease in temperature will lead to a decrease in volume. For comparing the same substance under two different sets of conditions, the law can be written as:
Vary the temperature of the gas and records its new volume, at the new temperature. Get series of values of V and T. Plot V and T values to get Charles' law graph.