Question #8298c

3 Answers
Mar 27, 2015

!! LONG ANSWER !!

So, you have your diprotic acid, #H_2A#, and the equilibrium reactions that take place in aqueous solution

#H_2A_((aq)) rightleftharpoons H_((aq))^(+) + HA_((aq))^(-)#, #pK_(a1) = 5.9#,

#HA_((aq))^(-) rightleftharpoons H_((aq))^(+) + A_((aq))^(2-)#, #pK_(a2) = 9.4#

This means that your solution will contain three species: #H_2A#, #HA^(-)#, and #A^(2-)#. The idea behind speciation is that the total concentration of a solution made by mixing these three species is constant, regardless of what actual proportions you have.

Each of these three species will have a fraction of the total concentration that depends on their respective concentrations. For example,

#([H_2A])/([H_2A] + [HA^(-)] + [A^(2-)]) = "fraction"_(H_2A)#

Now, I can't show you the actual calculations because that would make for a very, very long answer. If you use the definitions of the acid dissociation constants, #K_(a1)# and #K_(a2)#, you can write the fraction each species has by using the concentration of #H^(+)#, and #K_(a1)# and #K_(a2)#.

These fractions will look like this

# ([H^(+)]^(2))/([H^(+)]^(2+) + K_(a1)*[H^(+)] + K_(a1) * K_(a2))# #-># fraction of #H_2A#

#(K_(a1) * [H^(+)])/([H^(+)]^(2+) + K_(a1)*[H^(+)] + K_(a1) * K_(a2))# #-># fraction of #HA^(-)#

#(K_(a1) * K_(a2))/([H^(+)]^(2+) + K_(a1)*[H^(+)] + K_(a1) * K_(a2))# #-># fraction of #A^(2-)#

This form will help you with the actual speciation diagram because you can calculate these fractions for a given pH without too much trouble.

Start with pH = 0, determine #[H^(+)]# by using

#[H^(+)] = 10^(-pH)#

and the values of #K_(a1)# and #K_(a2)# from

#K_(a1) = 10^(-pK_(a1))# and #K_(a2) = 10^(-pK_(a2))#

For the entire pH range your diagram will look like this

http://www.skepticalscience.com/Mackie_OA_not_OK_post_8.html

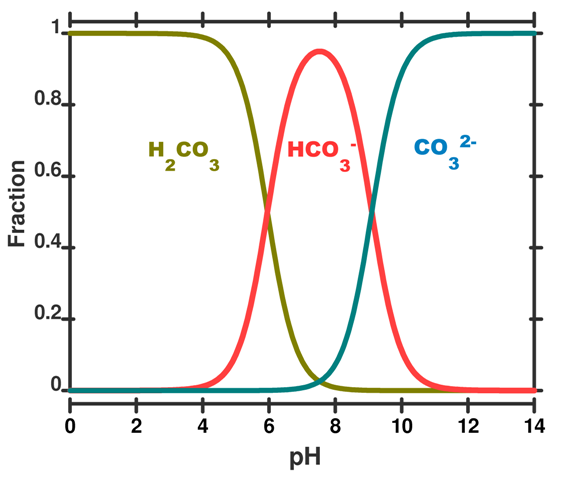
That speciation diagram belongs to #H_2CO_3#. Here's how you'd adapt yours.

  • The #color(green)("green")# curve will be #[H_2A]#;
  • The #color(red)("red")# curve will be #[HA^(-)]#;
  • The #color(blue)("blue")# curve will be #[A^(2-)]#;

Now, your #color(green)("green")# curve will intersect your #color(red)("red")# curve at #pK_(a1) = 5.9#, and your #color(red)("red")# curve will intersect your #color(blue)("blue")# curve at #pK_(a2) = 9.4#.

For the intermediate species, in your case #[HA^(-)]#, the pH of the solution will be

#pH_("intermediate") = (pK_(a1) + pK_(a2))/2 = (5.9 + 9.4)/2 = 7.65 ~= 7.7#

Mar 27, 2015

Here's a sample calculation of you you can derive the fractions formulas that only use #[H^(+)]#, #K_(a1)#, and #K_(a2)#

According to the definitions of #K_(a1)# and #K_(a2)#, you'll get

(1): #K_(a1) = ([H^(+)] * [HA^(-)])/([H_2A])#, and

(2): #K_(a2) = ([H^(+)] * [A^(2-)])/([HA^(-)])#

I'll use this notation for simplicity

#[H_2A] = x#, #[HA^(-)] = y#, and #[A^(2-)] = z#.

The fraction of #[H_2A]# will be

#f_(H_2A) = x/(x + y + z)# (MAIN)

Use (1) to write a value for #x#

#x = ([H^(+)] * y)/K_(a1)# (A)

Use (2) to get a value for #y#

#y = ([H^(+)] * z)/K_(a2)# (B)

Plug (B) into (A)

#x = ([H^(+)] * [H^(+)] * z)/(K_(a1) * K_(a2)) = ([H^(+)]^(2) * z)/(K_(a1) * K_(a2))#

Now plug everything into (MAIN) and you'll get

#f_(H_2A) = (([H^(+)]^(2) * z)/(K_(a1) * K_(a2)))/(([H^(+)]^(2) * z)/(K_(a1) * K_(a2)) + ([H^(+)] * z)/K_(a2) + z)#

#f_(H_2A) = ([H^(+)]^(2) * z)/(K_(a1) * K_(a2) * (([H^(+)]^(2) * z)/(K_(a1) * K_(a2)) + ([H^(+)] * z)/K_(a2) + z))#

#f_(H_2A) = ([H^(+)]^(2) * cancel(z))/(([H^(+)]^(2) * cancel(z) + K_(a1) * [H^(+)] * cancel(z) + K_(a1) * K_(a2) * cancel(z))#

Finally,

#f_(H_2A) = ([H^(+)]^(2))/([H^(+)]^(2) + K_(a1) * [H^(+)] * K_(a1) * K_(a2))#

Mar 27, 2015

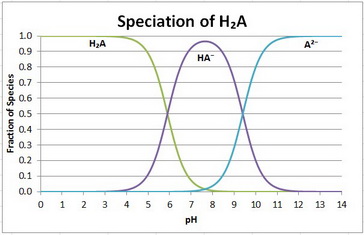
The speciation diagram is

enter image source here

Your equilibria are

H₂A ⇌ H⁺ + HA⁻; #"p"K_1 = 5.9#
HA⁻ ⇌ H⁺ + A²⁻; #"p"K_2 = 9.4#

There are three species: H₂A, HA⁻, and A²⁻.

The material balance is given by

#C = "[H₂A] + [HA⁻] + [A²⁻]"#, where #C# is the total concentration of the acid.

The fraction of each species is given by

#f_"H₂A" = "[H₂A]"/C#
#f_"HA⁻" = "[HA⁻]"/C#
#f_"A²⁻" = "[A²⁻]"/C#

I will omit the detailed calculations because, Stefan Zdre has done them for you.

Let #D = "[H⁺]"^2 + K_1"[H⁺]" + K_1K_2#

#f_"H₂A" = "[H⁺]"^2/D#; #f_"HA⁻" =( K_1"[H⁺]")/D#; #f_"A²⁻" = (K_1K_2)/D#

Now we can use Excel to plot the fraction of each species as a function of pH.

The data are

enter image source here

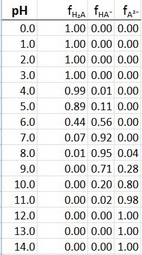
I actually plotted the data at 0.2 pH intervals to get more points. The plots are shown at the beginning of this answer.

Note how the plots cross over at exactly #"p"K_1# and #"p"K_2#.

The #color(purple)("purple")# HA⁻ line doesn't make it all the way back up to 1.00 because the #"p"K# values are so close.

But it does peak at pH 7.6, which is the average of #"p"K_1# and #"p"K_2#.