Question #8298c
3 Answers
!! LONG ANSWER !!
So, you have your diprotic acid,
This means that your solution will contain three species:
Each of these three species will have a fraction of the total concentration that depends on their respective concentrations. For example,
Now, I can't show you the actual calculations because that would make for a very, very long answer. If you use the definitions of the acid dissociation constants,
These fractions will look like this
This form will help you with the actual speciation diagram because you can calculate these fractions for a given pH without too much trouble.
Start with pH = 0, determine
and the values of
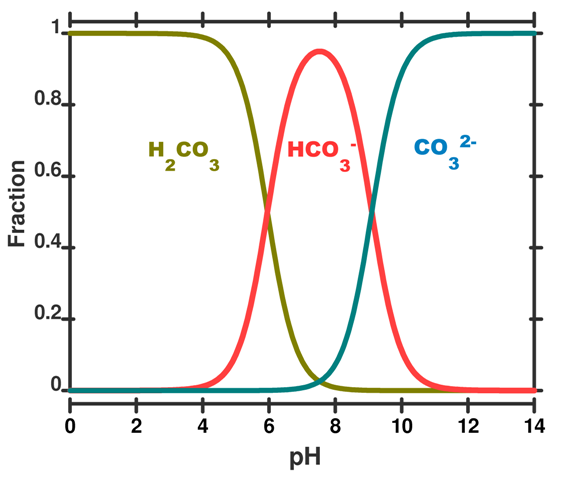
For the entire pH range your diagram will look like this

That speciation diagram belongs to
- The
#color(green)("green")# curve will be#[H_2A]# ; - The
#color(red)("red")# curve will be#[HA^(-)]# ; - The
#color(blue)("blue")# curve will be#[A^(2-)]# ;
Now, your
For the intermediate species, in your case
Here's a sample calculation of you you can derive the fractions formulas that only use
According to the definitions of
(1):
(2):
I'll use this notation for simplicity
The fraction of
Use (1) to write a value for
Use (2) to get a value for
Plug (B) into (A)
Now plug everything into (MAIN) and you'll get
Finally,
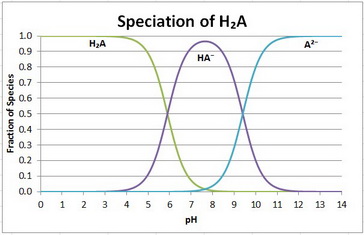
The speciation diagram is

Your equilibria are
H₂A ⇌ H⁺ + HA⁻;
HA⁻ ⇌ H⁺ + A²⁻;
There are three species: H₂A, HA⁻, and A²⁻.
The material balance is given by
The fraction of each species is given by
I will omit the detailed calculations because, Stefan Zdre has done them for you.
Let
Now we can use Excel to plot the fraction of each species as a function of pH.
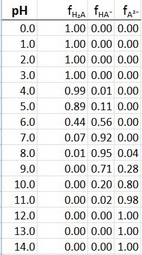
The data are

I actually plotted the data at 0.2 pH intervals to get more points. The plots are shown at the beginning of this answer.
Note how the plots cross over at exactly
The
But it does peak at pH 7.6, which is the average of


