How do you graph: #f(x)=4^x#?

1 Answer
Jul 25, 2015

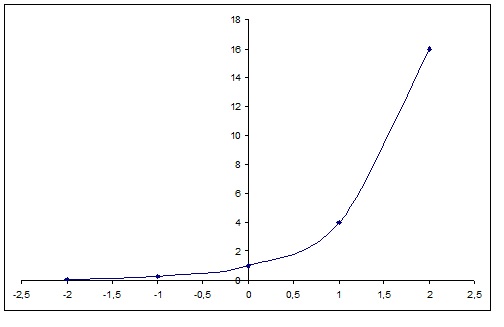
This is an exponential function:

Explanation:

In general your function will ALWAYS give you positive #y# values so the graph will be only in the first and second quadrant (forget about the negative #y# axis).
To plot the graph I would use "interesting" values as:
#x=0# that gives you #y=f(0)=4^0=1#
#x=1# that gives you #y=f(1)=4^1=4#
#x=2# that gives you #y=f(2)=4^2=16#

for the negative #x# I have to be careful because the value of #y# will become very small quite quickly so I try:
#x=-1# that gives you #y=f(-1)=4^-1=1/4=0.25#
#x=-2# that gives you #y=f(-2)=4^-2==1/4^2=1/16=0.06#
less than this will be difficult to plot consistently with the other points.
Graphically:

enter image source here