Can entropy be graphed in a phase diagram?
1 Answer
In some sense, yes. It's relatively straightforward. The entropy of a particular phase can be assumed to stay about the same within that phase (because the amount of rigidity is about the same). Typically, phase diagrams are pressure vs. temperature. If you keep the pressure constant, you can represent entropy, although indirectly.
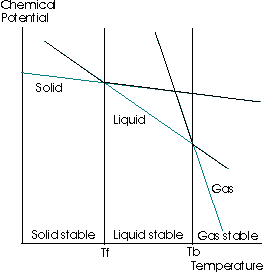
The following diagram is a graph of the change in the molar Gibbs' Free Energy with respect to a change in temperature, at a constant pressure

(The chemical potential is the molar Gibbs' Free Energy;
Focus on the green lines. The entropy is the negative slope of the
All this means is that as a solid, the entropy is lower than as a liquid, and as a liquid, the entropy is lower than as a gas. Hence, the slope is a higher magnitude for the gas than for the liquid than for the solid.

