Question #143ea
1 Answer

Nov 4, 2015
The rate of change is the same as slope.
Explanation:
You can use the example of an element's half-life. If an element has a half life of six seconds and you plot it on a graph, then you'd have something like this:
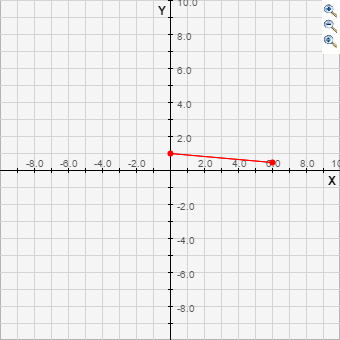
The x-axis represents the amount of time in seconds, and the y-axis represents the fraction of the atom remaining. Obviously, you could plot more points or extend the line to show different lengths of time in relationship to the amount of atom remaining.
On this graph, the slope is -1/12. As one second goes by, one twelfth of the atom disintegrates. The absolute value of the slope is equivalent to the rate of change.
