How do you use a phase diagram?
1 Answer

Check the explanation
Explanation:
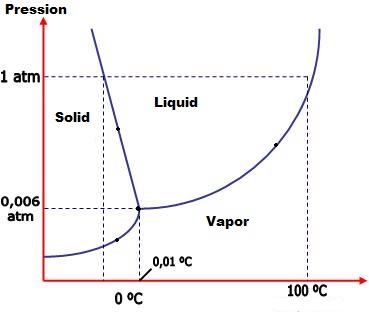
The phase diagram(of water, in the image) is a diagram that puts pressure in function of temperature. The lines are marks of the modification of the phase, and the points along the line have a changing phase, but not an specific one, by having both phases at the same conditions. Examples: Liquid/solid, Liquid/vapor, solid/vapor or even the tree of them - the triple point, solid/liquid/vapor.
On the phase diagram, there are 3 areas: Solid, Liquid and Vapor.
The line between Solid and Liquid marks the pressure and the temperature of the melting/solidification, and the points along the line have a changing phase called solid/liquid.
The line between Liquid and Vapor marks the pressure and the temperature of the evaporation/condensation, and the points along the line have a changing phase called liquid/vapor.
The line between Solid and Vapor marks the pressure and the temperature of the sublimation/inverse sublimation, and the points along the line have a changing phase called solid/vapor.
The triple point is the joint of the tree lines, and presents all the tree fases in the same condition.
