The question is asking us to create a polar plot of a function of angle, #theta#, which gives us #r#, the distance from the origin. Before starting we should get an idea of the range of #r# values we can expect. That will help us decide on a scale for our axes.
The function #cos(theta)# has a range #[-1 ,+1]# so the quantity in parentheses #1+cos(theta)# has a range #[0,2]#. We then multiply that by #2a# giving:
#r=2a(1+cos(theta)) in [0,4a]#
This is the ditance to the origin, which could be at any angle, so let's make our axes, #x# and #y# run from #-4a# to #+4a# just in case:
Next, it's useful to make a table of the value of our function. We know that #theta in [0,360^o]# and let's break it up into 25 points (we use 25 because that makes 24 steps between points which are angles of #15^o#):
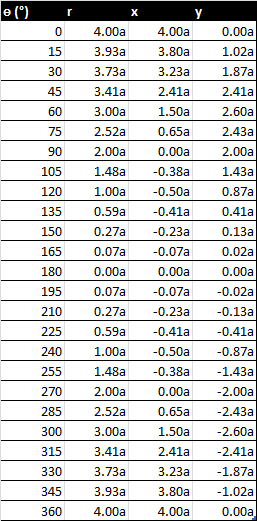
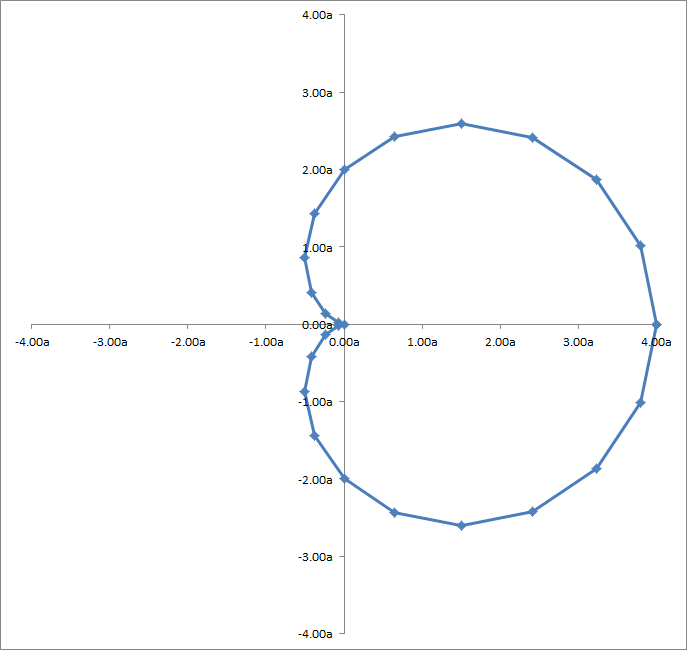
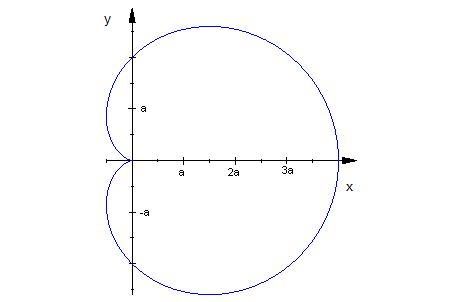
Where we have also included a calculation of the Cartesian coordinates of each point where #x=r*cos theta # and #y=r*sin theta#. We now have a choice, we can plot the points using a protractor for the angle and a ruler for the radius, or just use the #(x,y)# coordinates. When you are done, you should have something that looks like this: