On the WMAP image of the cosmic microwave background radiation, are the higher density irregularities the brighter bits or the darker bits?
1 Answer

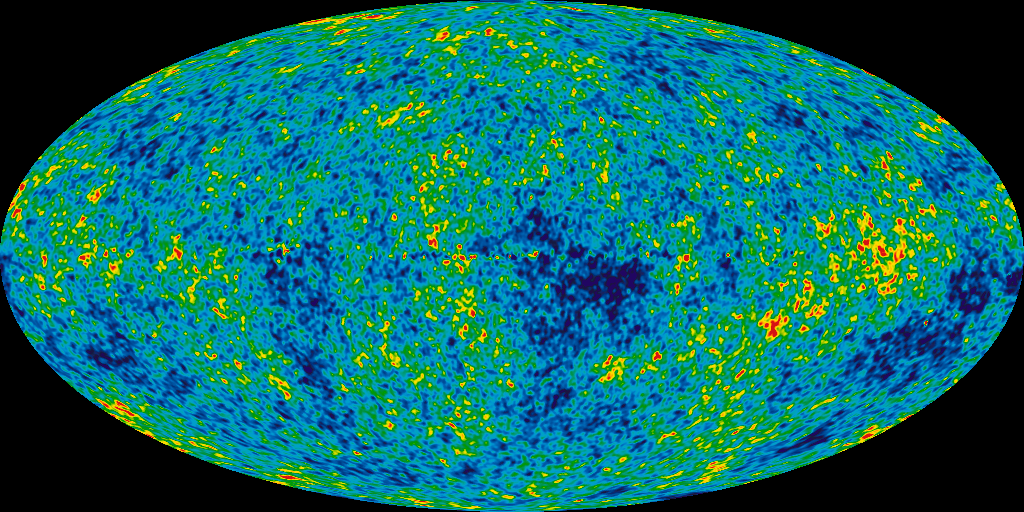
The colour code shows fluctuations of CMBR temperature about its mean value of
Explanation:
The averaged CMBR temperature is
Given below is a map of temperature fluctuations about this average value, created from the 9 year data of WMAP. In this map the temperature fluctuations about the average value are shown in a scale of
Colour Code:
The pixels in red represent temperatures that are
The pixels in dark blue represent temperature that are
What do they mean?: Higher temperature indicates higher matter density.
Density Contrast Field: Fluctuations in mass density are quantified by the density contrast field
Temperature Contrast Field: Fluctuations in CMBR temperature are quantified by the temperature contrast field
There is direct relation connecting the two which can be deduced from the fundamental principles: