How would you explain the phase diagram of sulphur?
1 Answer

Apr 8, 2016
How about this:
Explanation:
A phase diagram is a chart that shows the conditions of pressure and temperature at which distinct phases occur and coexist at equilibrium.
The lines on a phase diagram divide into regions – solid, liquid, and gas.
The phase diagram of sulfur is
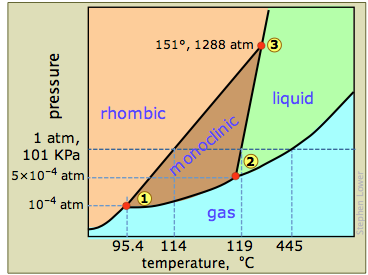
The diagram is complicated by the fact that sulfur can exist in two crystalline forms: rhombic and monoclinic.
Let's look first at the four areas:
- Pink — only rhombic sulfur
- Brown — only monoclinic sulfur
- Green — only liquid sulfur
- Blue — gaseous sulfur
The corresponding curves are:
- lower left to ① — the sublimation curve of rhombic
#"S"# :#"S(rhombic)" ⇌ "S(g)"# - ① to② — the sublimation curve of monoclinic
#"S"# :#"S(monoclinic") ⇌"S(g)"# - ② to upper right — the vapour pressure curve of liquid
#"S"# :#"S(l)" ⇌ "S(g)"# - ① to ③ — the transition curve for
#"S(rhombic)" ⇌ "S(monoclinic)"# - ② to ③ — the melting point curve for
#"S(monoclinic) ⇌ S(l)"# - ③ to top — the melting point curve for
#"S(rhombic) ⇌ S(l)"#
There are three triple points:
- ① (
#"95.4 °C", 1 × 10^"-4"color(white)(l) "atm"# ) — rhombic#"S"# is in equilibrium with monoclinic#"S"# , and both have the same vapour pressure. - ② (
#"119 °C", 5× 10^-4color(white)(l) "atm"# ) — monoclinic#"S"# melts; this is the triple point for#"S"_"m" ⇌ "S"_"l" ⇌ "S"_"g"# . - ③ (
#"151 °C, 1288 atm"# ) — rhombic, monoclinic, and liquid#"S"# are at equilibrium.
The critical point — where liquid and gaseous
