How do you graph the quadratic function and identify the vertex and axis of symmetry for #y=-2(x+3)^2-4#?
1 Answer

See below.
Explanation:
This quadratic function will have a vertex at
The equation of the axis of symmetry (it is a vertical line) will be
To graph, it is not only helpful to know the vertex and the equation of the axis of symmetry. Intercepts, both x and y, and direction of opening is extremely important.
Let's start with the latter. The parameter
Here,
Now for x-intercepts. These can be obtained by setting
So, there is no x-intercept. We could have figured out without algebra, because the vertex lies below the x-axis and the parabola opens downwards.
As for y-intercepts, set
Let's finish by identifying the domain and range. The domain is
We can now graph, using a table of values and connecting the points using a smooth, curved line.
Here is what your graph should look like:
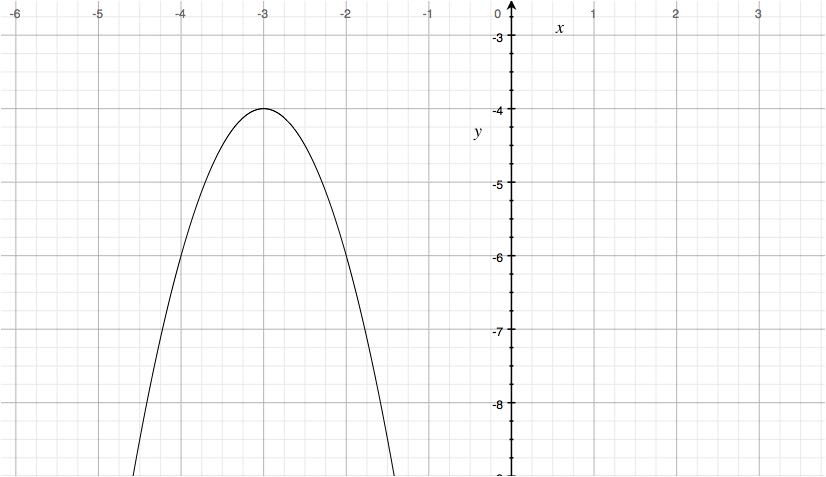
Hopefully this helps!
