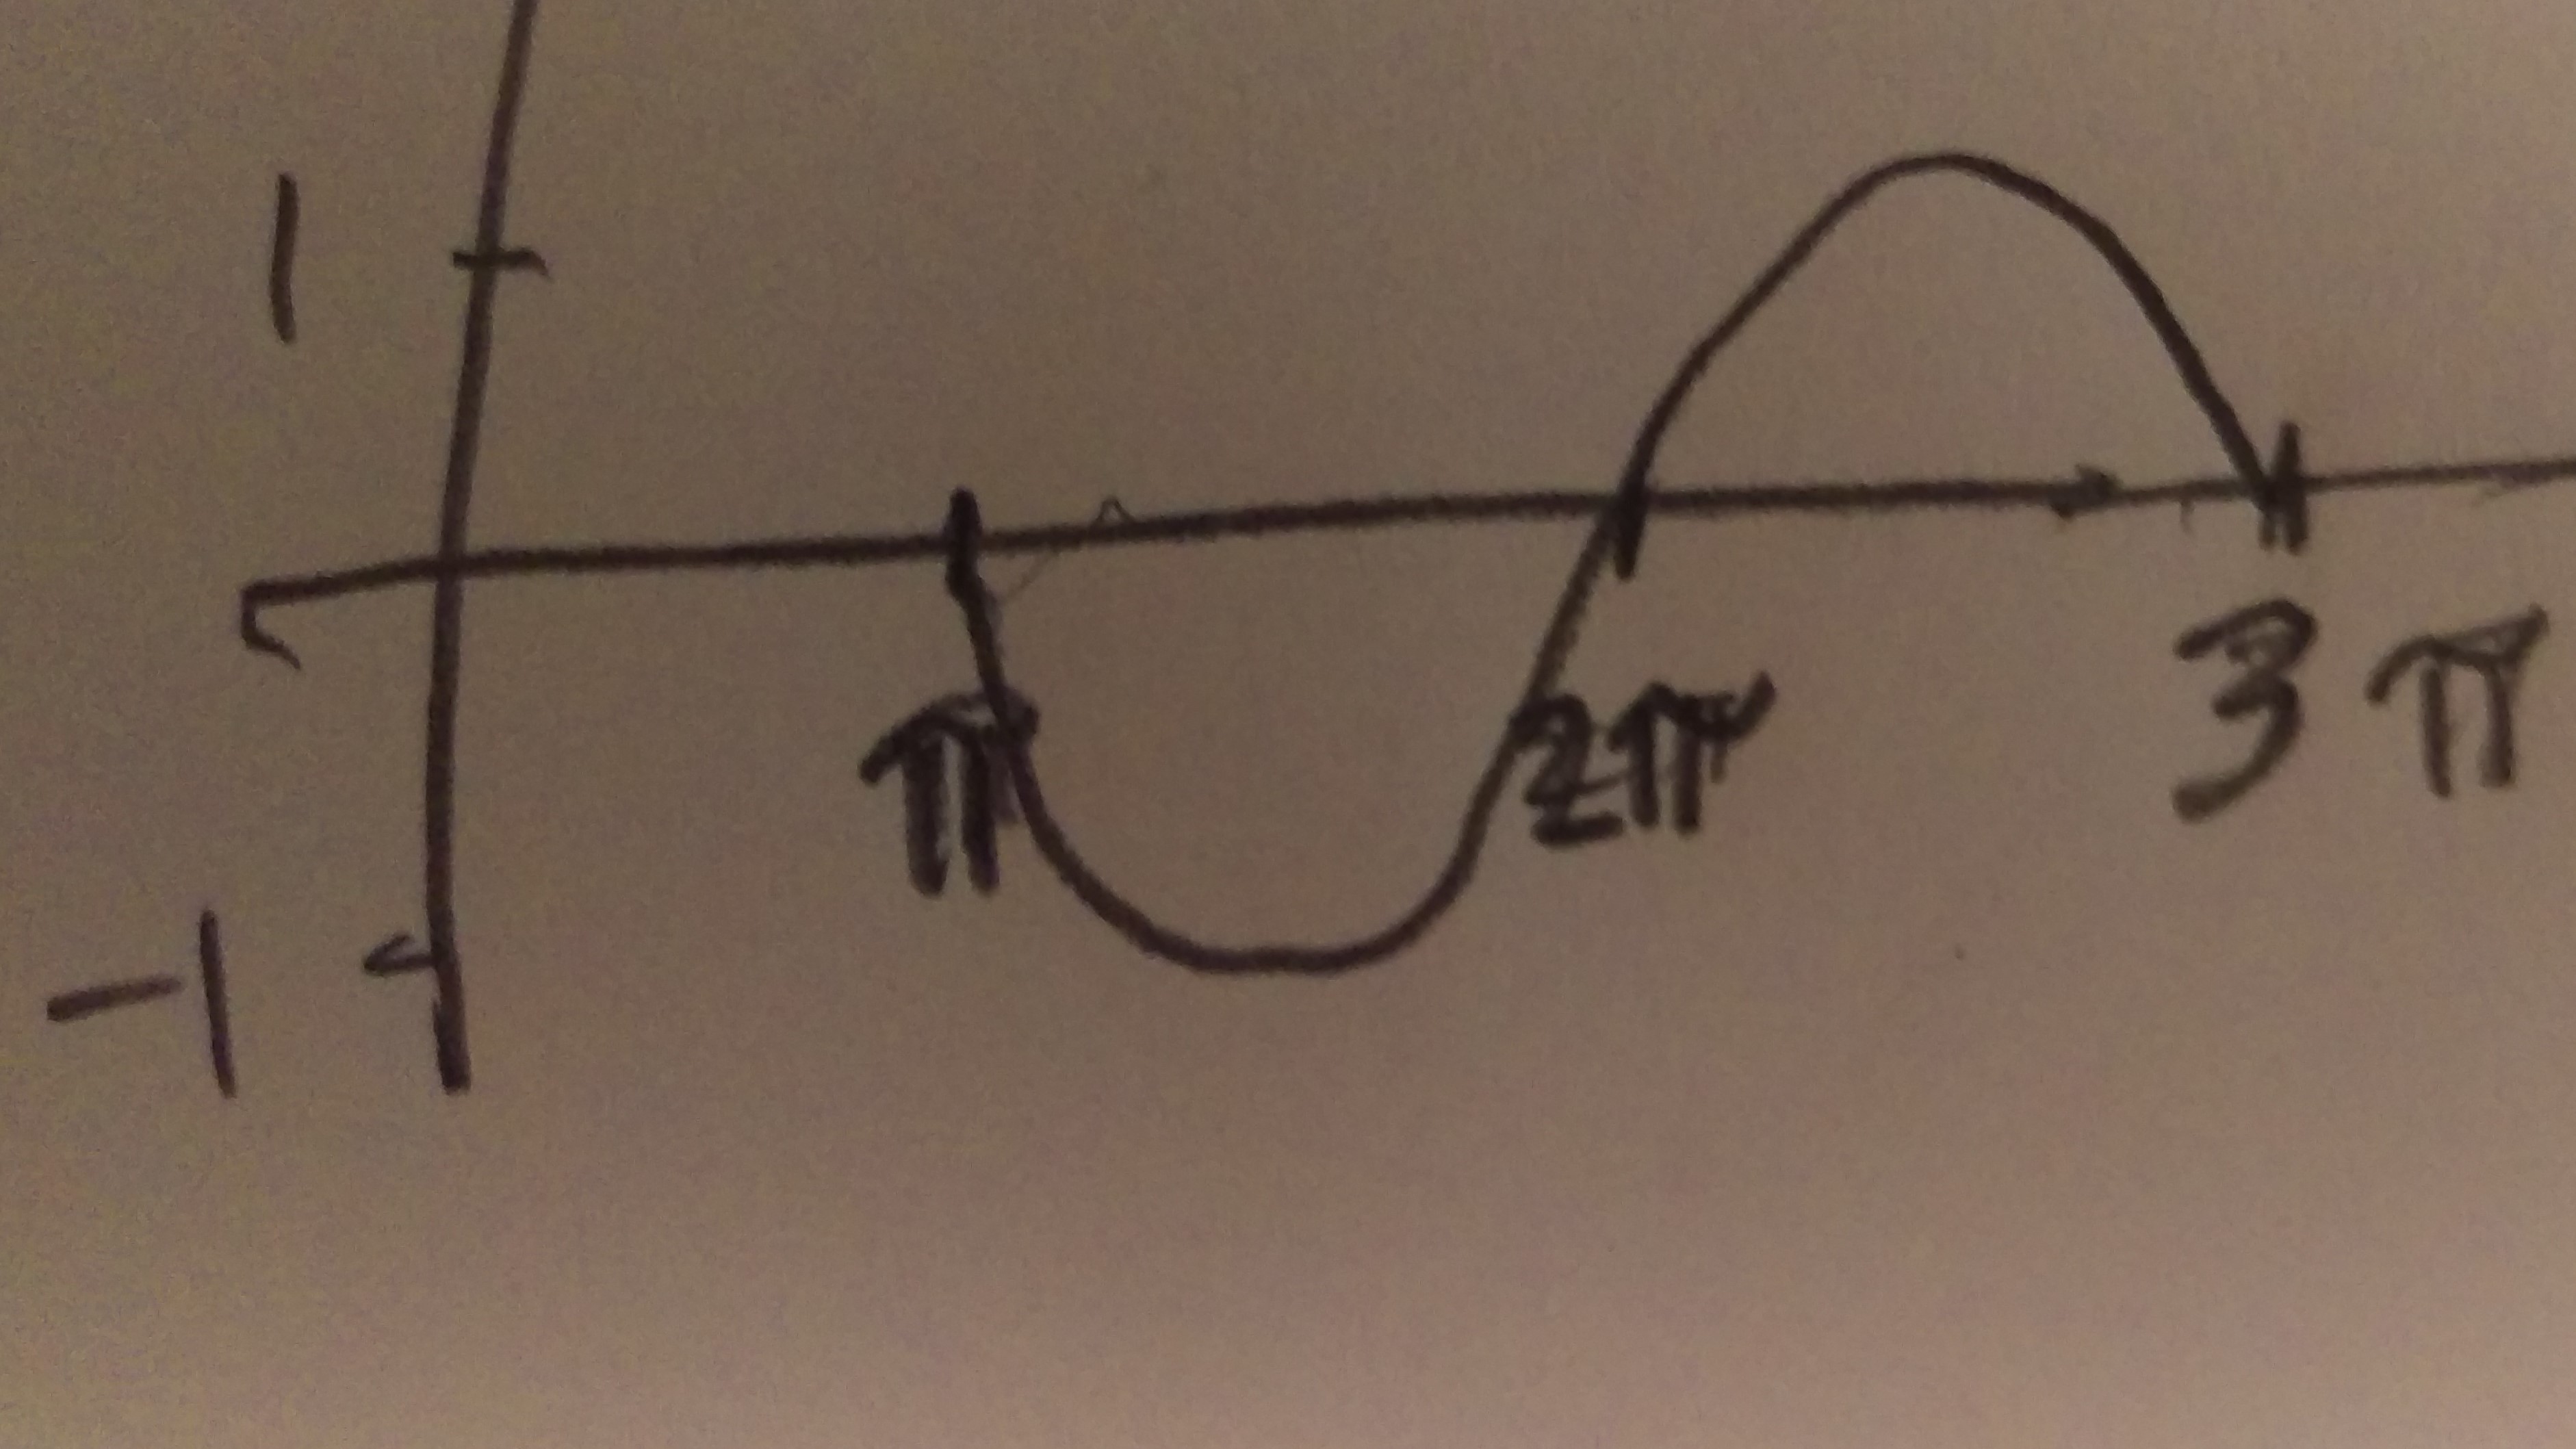
How do you graph and list the amplitude, period, phase shift for #y=-sin(x-pi)#?

1 Answer
Sep 9, 2016

Use the form #y=Asin(Bx-C)+D#

Explanation:

#y=Asin(Bx-C)+D#

#abs(A)# = amplitude
#(2pi)/B# = period
#C/B# = phase shift
#D# = vertical shift

#y=-sin(x-pi)#

In this example, #A=-1# and #absA = 1# so the amplitude is 1.

Period = #(2pi)/B = (2pi)/1 = 2pi#

Phase shift = #C/B = pi/1=pi# to the right. A negative sign in the parentheses means shift right.

To graph, one complete sine curve must be #2pi# "wide" because the period is #2pi#. And, a phase shift of #pi# to the right means the beginning of the sine curve should start at #pi#. Also, note the negative in front of the sin. That means the graph should be flipped over the x axis.

enter image source here