How do you solve the following by quadratic equation for x given 15x^2-16xy-15x^2=0?
2 Answers
(...but see below)
Explanation:
Since
A quadratic equation is normally of the form:
We could treat the given equation as if it were in this form with
The Quadratic Formula tells us
This would give us

This is more of a case of providing information rather than solving the question. Unfortunately the image quality is not so good.
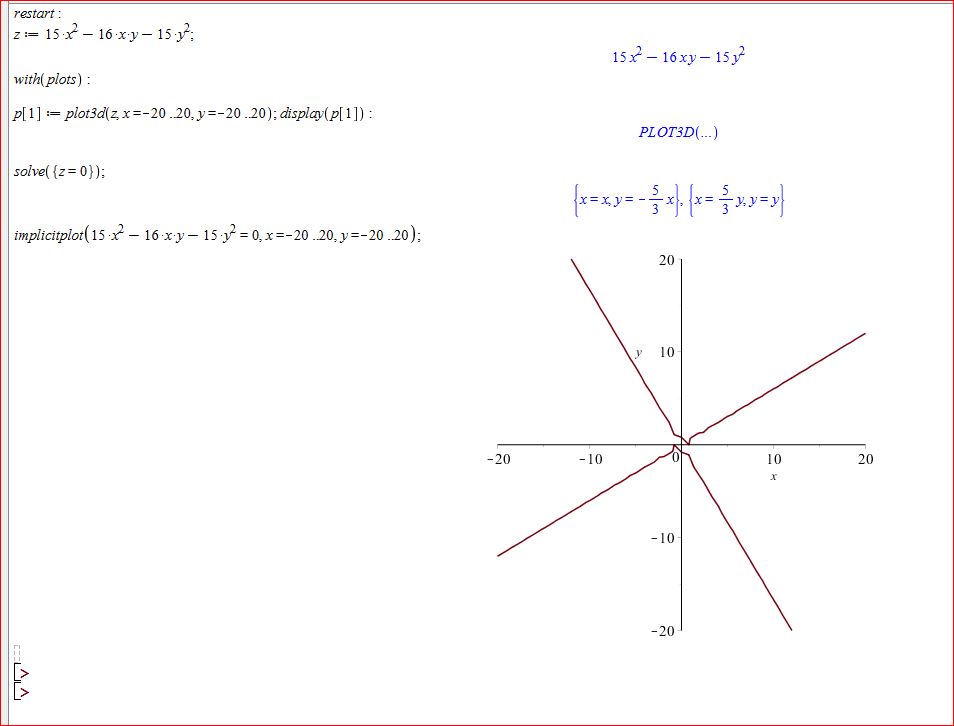
Using Maple I built the following:
Explanation:
In this image you can see the contour plot of that intersection.
Consider the cross section of the curved surface in the zy-plane. Observe that the vertex of that quadratic curve is considerably to the left of y=0.
Thus the termination point of the curves LHS has a significantly greater value for z than the RHS. Because of this, in the xy-plane view, the centre line of the saddle is sloping from the bottom left to the top right.
Consequently will influence the contour (implicitplot) of the line z=0 and produce the skewed affect.
In this image you can see the intersection of the plane
Also displayed is the Maple solution for
i.e.
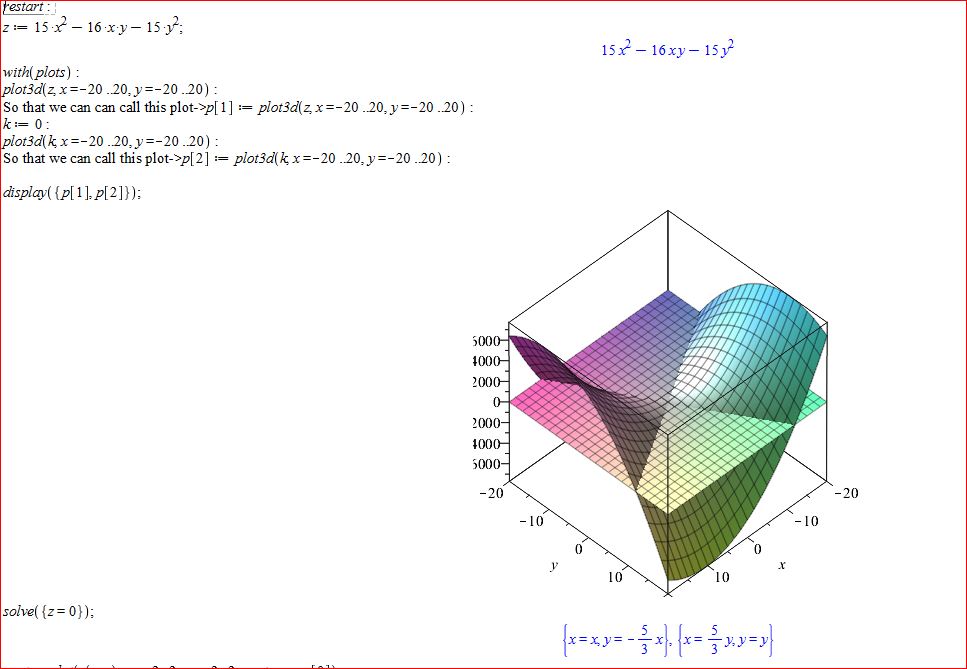
Maples solution reads:
To demonstrate the solution output comparison to the contour plot have a look at:
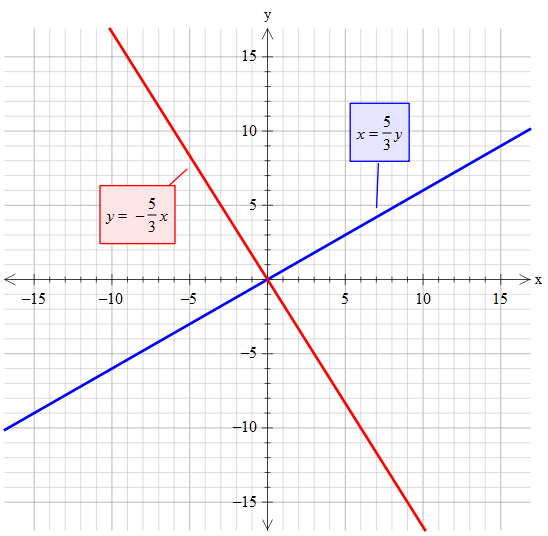
This compares very well. Note that the saddle surface and the
