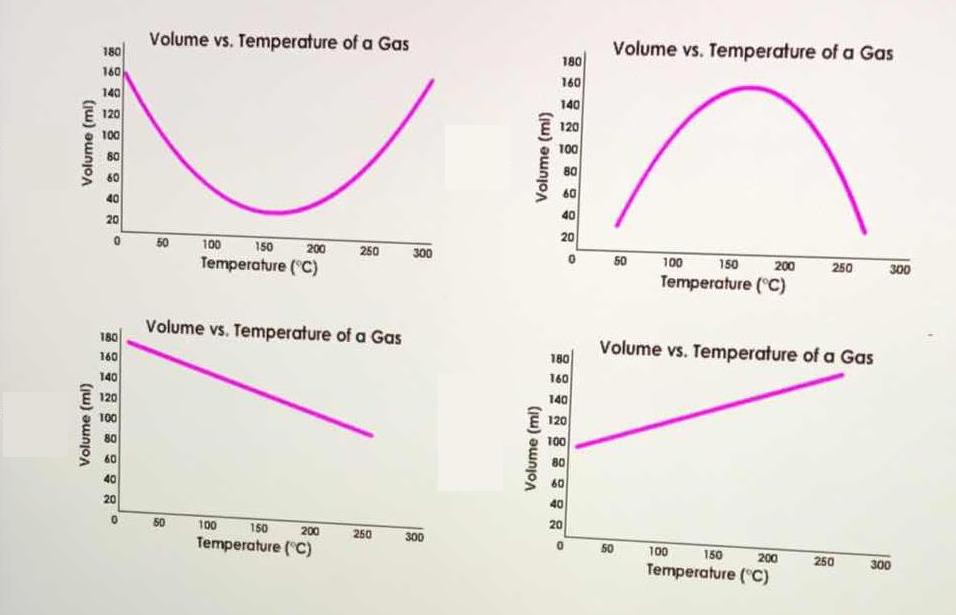
Which graph shows the relationship between the temperature and volume of a gas according to Charles's law?
1 Answer
Jan 7, 2017
Explanation:
So if
And if
So if
And if
