How do I make a phase diagram for water?
1 Answer

By knowing where the normal boiling and freezing points are (at
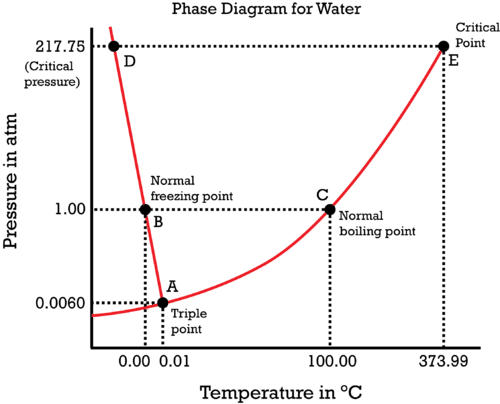
Note that the phase diagram is simply a pressure vs. temperature graph.
We know that
The critical point is when the liquid and vapor exist at the same time, at some
The triple point is when the solid, liquid, and vapor exist at the same time, at some
The Clapeyron equation describes the slope of a coexistence curve,
#DeltabarH_"trs"# is the molar enthalpy of the phase transition.#DeltabarV_"trs"# is the change in molar volume due to the phase transition.#T# is the temperature in#"K"# .
Using the Clapeyron equation:
- For the liquid-solid coexistence curve in the phase diagram of water,
#(dP)/(dT) < 0# , since#DeltabarV_((l)->(s)) > 0# , and#DeltabarH_"frz" < 0# , which indicates that water expands when it freezes (this is unusual). - For the liquid-vapor coexistence curve,
#(dP)/(dT) > 0# , since#DeltabarV_((l)->(g)) > 0# , and#DeltabarH_"vap" > 0# , which indicates that water expands when it vaporizes (as usual). - For the solid-vapor coexistence curve,
#(dP)/(dT) > 0# , since#DeltabarV_((s)->(g)) > 0# , and#DeltabarH_"sub" > 0# , which indicates that water expands when it sublimates (clearly).
Put all that together into a phase diagram:
Simply note where each point is, and you should be able to at least sketch its general shape. Note that the phase diagram is simply a pressure vs. temperature graph.
