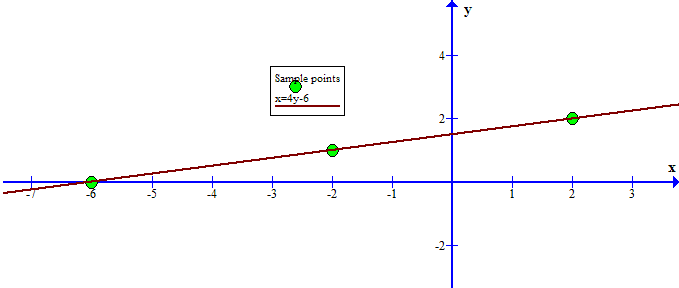
How do you graph x=4y-6?
1 Answer
Mar 15, 2017
Pick some sample values for
then plot the resulting points and draw a line through them.
Explanation:
For example, given
{:(ul(y),,ul(x)),(0,rarr,-6),(1,rarr,-2),(2,rarr,2):}
Plotting these 3 sets of coordinates and drawing a straight line through them:

