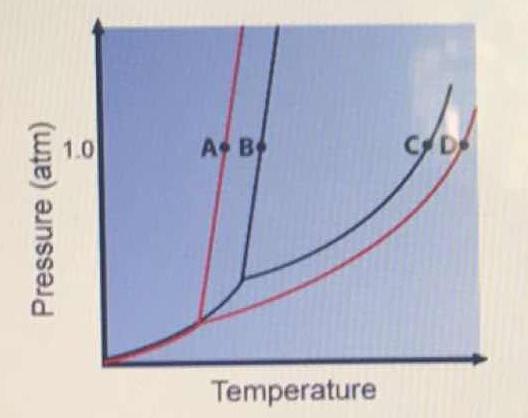
The figure shows two phase diagrams, one for a pure liquid (black line) and the other for a solution made using the liquid as the solvent (red line). What does point B represent?
1 Answer

Consider the following general phase diagram:
Now, consider the pure substance, whose phase diagram was represented by the black curves.
The normal freezing point of the pure substance at constant pressure is indicated by
#DeltaT_f = T_f - T_f^"*" = -iK_fm#
is the freezing point depression equation, where:
Now consider the solution made using the pure liquid substance as the solvent, with the phase diagram indicated by the red curves.
Similarly, the normal boiling point of the pure substance at constant pressure is indicated by
#DeltaT_b = T_b - T_b^"*" = iK_bm#
is the boiling point elevation equation, where:
#i# and#m# are as defined before.#K_b# is the boiling point elevation constant.#T_b# is the boiling point, and#"*"# indicates the pure solvent.
