How do you solve 2.5x + 1.75y \leq 200?
3 Answers
Cant be solved as there are 2 unknowns but only 1 equation.
Please see below.
Explanation:
Let us first consider the equality
Let
Similarly one can identity that line passes through
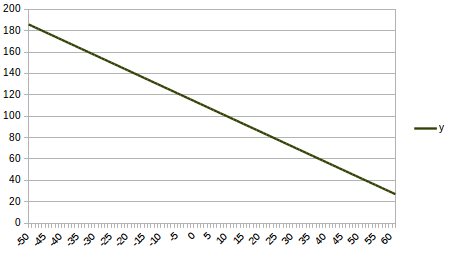
graph{10x+7y=800 [-40, 40, 0, 200]}
Note that the graph is not drawn to scale but it wil still serve our purpose. This graph divides Cartesian plane in three parts,
-
one the line
2.5x+1.75y=200 or10x+7y=800 itself. On this point we get2.5x+.175y=0 and hence, the line is also a solution to2.5x+1.75y <= 200 -
two the area to the left of the line
2.5x+1.75y=200 . Observe that(0,0) lies on it. On this point we get2.5x+1.75y=0 i.e.2.5x+1.75y < 0 . This satisfies the inequality and hence, area to left of the line is also a solution. -
three the area to the right of the line
2.5x+1.75y=200 . Observe that(20,100) lies on it. On this point we get2.5x+1.75y=2.5xx20+1.75xx100=50+175=225 i.e.2.5x+1.75y > 200 . This area does not satisfy the inequality and hence, area to right of the line is not a solution.
Hence solution to
graph{2.5x+1.75y <= 200 [-40, 40, 0, 200]}
Note
graph{2.5x+1.75y < 200 [-40, 40, 0, 200]}

One way to do inequalities is to first solve the expression as an equality, then select the range that also satisfies the inequality.
Explanation:
In this case we will have a range of values across x and y. We can rearrange the expression as a linear equality:
This equation describes a line that we can plot. From the plot we will select an (x,y) pair value on one side of the line. If it satisfies the inequality, that is the area of values that are the solution. If it does not, then the solution space is on the other side of the line.
Let’s try (0,40):
So, our solution range is under (and including the line).
Check the other side, (25,140):
NOT true, so it confirms our selected solution space.
