How do i describe and explain the position of a median on a box plot?
1 Answer

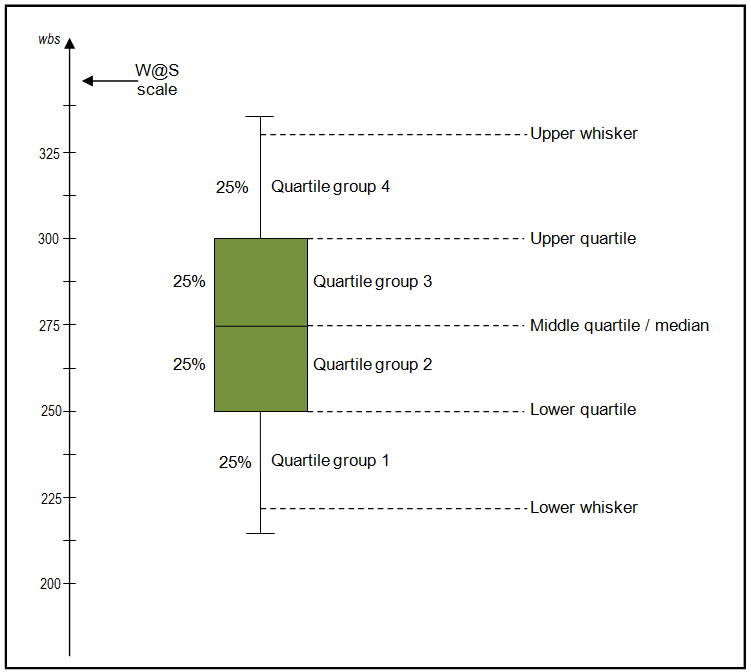
The median is the dark line in the middle of the box.
Explanation:
The median is the line in the middle of the box.
In the example below, it appears the median is 275 or close to it.
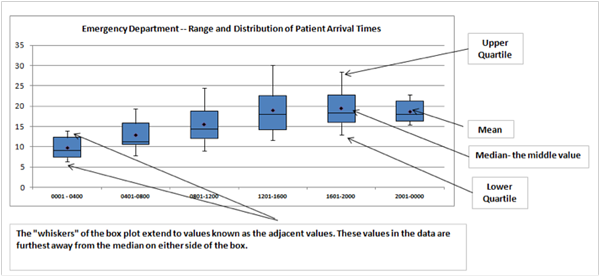
In the next example below, the median is .2450.
Remember that the box shows you quartiles two and three. You can describe where the median falls in relation to these quartiles and you can describe where the median is in relation to your data in general.
In the two examples above, the median falls squarely between the second and third quartiles, but this doesn't have to be the case. The median can also be skewed in a certain direction.
In the example below, in the first box plot, we can see that the data is more condensed than the data in the second plot. The range of the second box plot is larger than the first plot and the median falls closer to the bottom of the second quartile.
To read more about box plots and their interpretation, see here.
